


Anthem Biosciences Stock Shows Inverted Head and Shoulders Pattern; Bullish Breakout Ahead?
Synopsis: Anthem Biosciences Ltd has formed an inverted head-and-shoulders pattern on the 4-hour chart, indicating a potential near-term bullish reversal. The inverted head-and-shoulders pattern reflects weakening selling pressure and increasing buying interest. The inverted head-and-shoulders pattern consists of three troughs, with the middle trough forming the lowest point (the head) and the two outer troughs […] The post Anthem Biosciences Stock Shows Inverted Head and Shoulders Pattern; Bullish Breakout Ahead? appeared first on Trade Brains.


Synopsis: Anthem Biosciences Ltd has formed an inverted head-and-shoulders pattern on the 4-hour chart, indicating a potential near-term bullish reversal.
The inverted head-and-shoulders pattern reflects weakening selling pressure and increasing buying interest. The inverted head-and-shoulders pattern consists of three troughs, with the middle trough forming the lowest point (the head) and the two outer troughs forming higher lows (the shoulders). A breakout above the neckline signals a potential bullish reversal.
On Thursday, Anthem Biosciences Ltd broke above the neckline of an inverted head-and-shoulders pattern on the 4-hour chart. A sustained move above Rs 714 could lead to further upside, while a decline below this level may weaken the bullish outlook.
For an inverted head-and-shoulders pattern, targets are typically set at the immediate resistance level or by projecting the distance from the head to the neckline upward. Traders often trail profits while monitoring volume and momentum for confirmation.
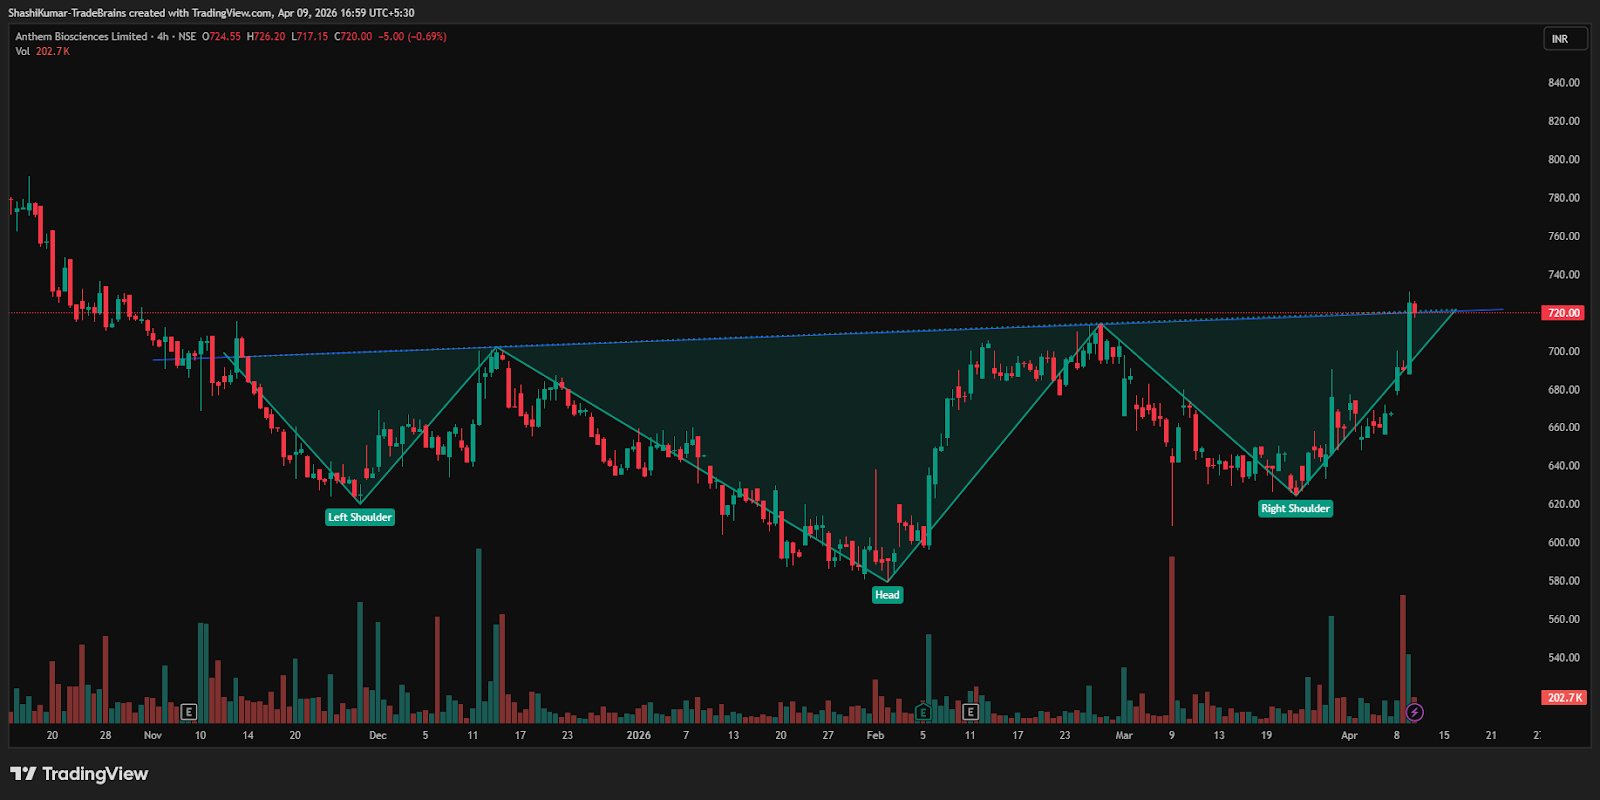
Anthem Biosciences Ltd Chart: 4-hour Timeframe
Indicator Confirmation
RSI: The daily RSI indicates bullish momentum, as it rose from 60.66 in the previous trading session to 67.06 on Thursday.
MACD: On the daily time frame, the blue MACD line was above the orange signal line, with the histogram turning green, indicating bullish momentum.
Moving Averages: On the daily time frame, the 5-day moving average was above the 9-day moving average, further confirming a bullish trend.
Price Volume Trend: The Price Volume Indicator confirms the uptrend, accompanied by a sharp increase in buying volume in the daily time frame.
Implications
The inverted head-and-shoulders pattern signals potential upside. Sustaining above the Rs 714 support level, supported by strong volumes, would strengthen near-term bullish momentum.
About the stock
Founded in Bangalore on June 13, 2006, Anthem Biosciences Ltd is an innovation-driven CRDMO offering integrated drug discovery, development, and manufacturing services. It is among the few Indian companies with capabilities across both new chemical and biological entities. Serving global biotech and pharmaceutical clients, Anthem focuses on innovation, high quality, and a customer-first approach to solve complex biology and chemistry challenges.
Over the past month, Anthem Biosciences Ltd has risen by 9.07%. However, over the last six months, the stock has fallen by 6.83% and shows a year-over-year decline of 1.42%. For more such technical stock ideas, click here to view our research page.
Disclaimer: The views and investment tips expressed by investment experts/broking houses/rating agencies on tradebrains.in are their own, and not that of the website or its management. Investing in equities poses a risk of financial losses. Investors must therefore exercise due caution while investing or trading in stocks. Trade Brains Technologies Private Limited or the author are not liable for any losses caused as a result of the decision based on this article. Please consult your investment advisor before investing.
The post Anthem Biosciences Stock Shows Inverted Head and Shoulders Pattern; Bullish Breakout Ahead? appeared first on Trade Brains.
What's Your Reaction?