


Bullish Setup: Escorts Kubota Stock Forms Double-Bottom pattern; Check the charts
Synopsis: Escorts Kubota Ltd has formed a double-bottom pattern on the 1-hour chart, signalling a potential near-term bullish reversal. The formation of a double bottom after a prolonged downtrend highlights strong buying interest at lower levels. A decisive breakout above the neckline signals a potential shift toward a bullish trend. On the chart, the stock […] The post Bullish Setup: Escorts Kubota Stock Forms Double-Bottom pattern; Check the charts appeared first on Trade Brains.


Synopsis: Escorts Kubota Ltd has formed a double-bottom pattern on the 1-hour chart, signalling a potential near-term bullish reversal.
The formation of a double bottom after a prolonged downtrend highlights strong buying interest at lower levels. A decisive breakout above the neckline signals a potential shift toward a bullish trend.
On the chart, the stock has broken above the double-bottom neckline and continues to hold above it. After finding support near the neckline, the price rebounded and moved higher.
On Thursday, Escorts Kubota Ltd held above the double-bottom neckline on the 1-hour chart, confirming the pattern. Sustained trading above this level, supported by steady buying, signals near-term bullish momentum and potential for further gains.
In a double-bottom pattern, upside targets are usually set at resistance levels above the neckline. Traders often use these zones to book profits while watching price action for signs of sustained momentum or exhaustion.
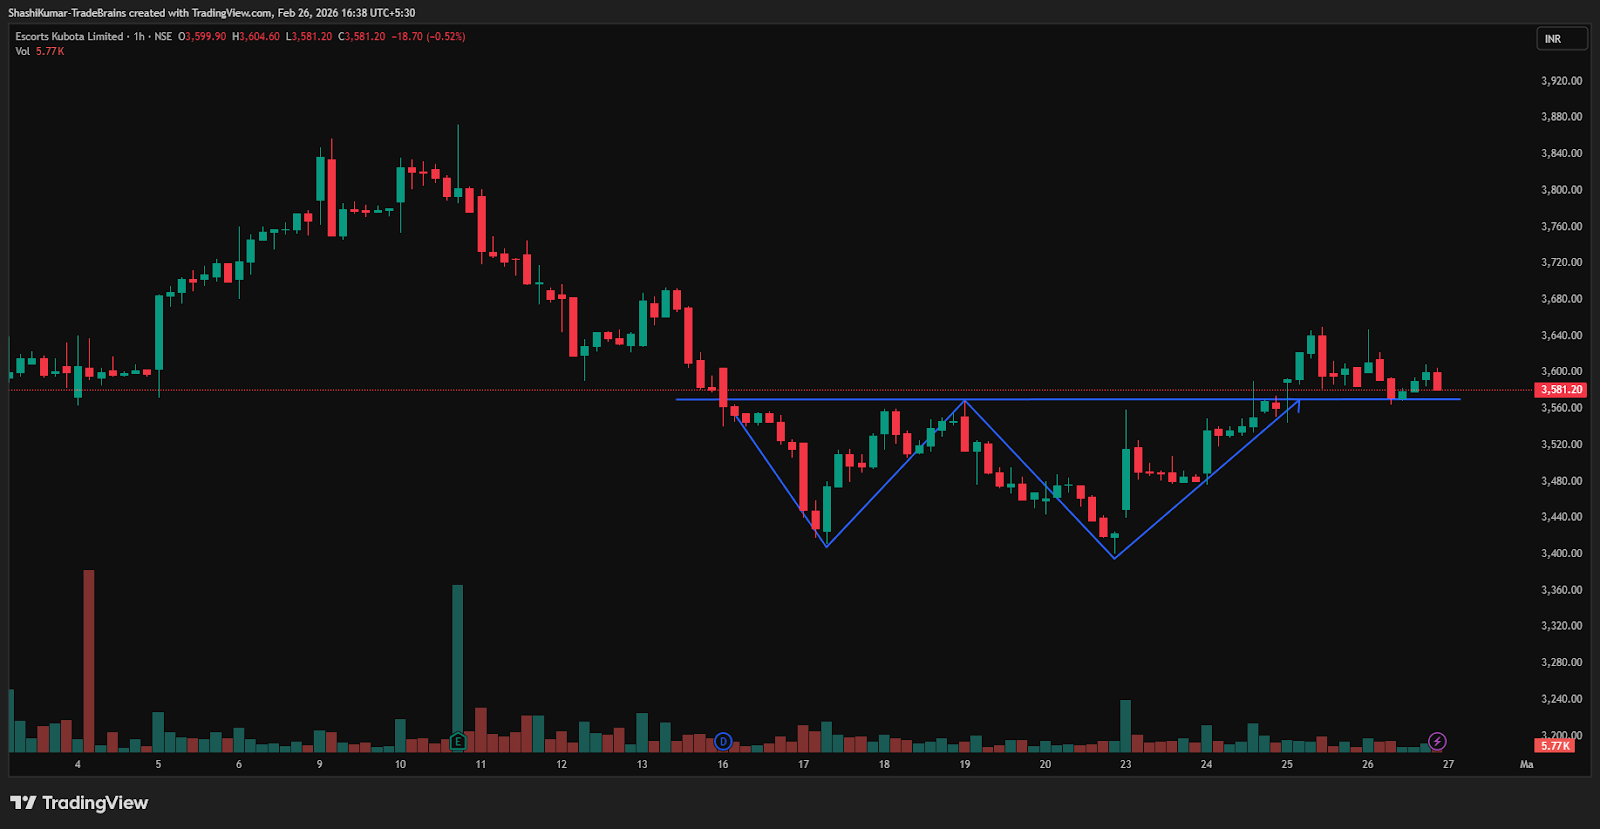
Escorts Kubota Ltd Chart: 1-hour Timeframe
Indicator Confirmation
- MACD: On the daily time frame, the blue MACD line was above the orange signal line, with the histogram turning green, indicating bullish momentum.
- Moving Averages: On the daily time frame, the 5-day moving average is above the 9-day moving average, further confirming a bullish trend.
Implications
A double-bottom pattern suggests potential upside momentum. A strong close above Rs 3,570 with healthy volumes would confirm the reversal and limit false breakout risks. Sustaining above Rs 3,570, now acting as support, would reinforce the near-term bullish trend.
About the stock
Escorts Kubota Limited is a leading Indian engineering firm specialising in agricultural machinery and construction equipment, featuring brands like Farmtrac, Powertrac, and Kubota. In Q3 FY26, the company maintained a 10.8% domestic tractor market share. Operational efficiency remained strong, with capacity utilisation reaching approximately 75% for the tractor division and 60% for construction equipment.
Over the past month, Escorts Kubota Ltd has delivered a gain of 3.21%. Over the last six months, the stock has remained largely flat with a modest uptick of 0.81%, while on a year-over-year basis, it has risen by 22.42%. For more such technical stock ideas, click here to view our research page.
Disclaimer: The views and investment tips expressed by investment experts/broking houses/rating agencies on tradebrains.in are their own, and not that of the website or its management. Investing in equities poses a risk of financial losses. Investors must therefore exercise due caution while investing or trading in stocks. Trade Brains Technologies Private Limited or the author are not liable for any losses caused as a result of the decision based on this article. Please consult your investment advisor before investing.
The post Bullish Setup: Escorts Kubota Stock Forms Double-Bottom pattern; Check the charts appeared first on Trade Brains.
What's Your Reaction?