


Cardano Bottom Signal? Shorts Hit Highest Level Since June 2023
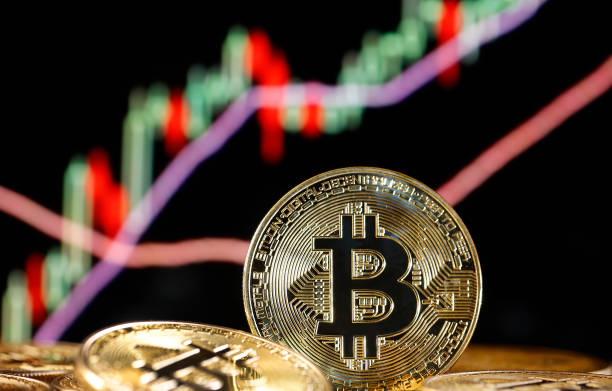
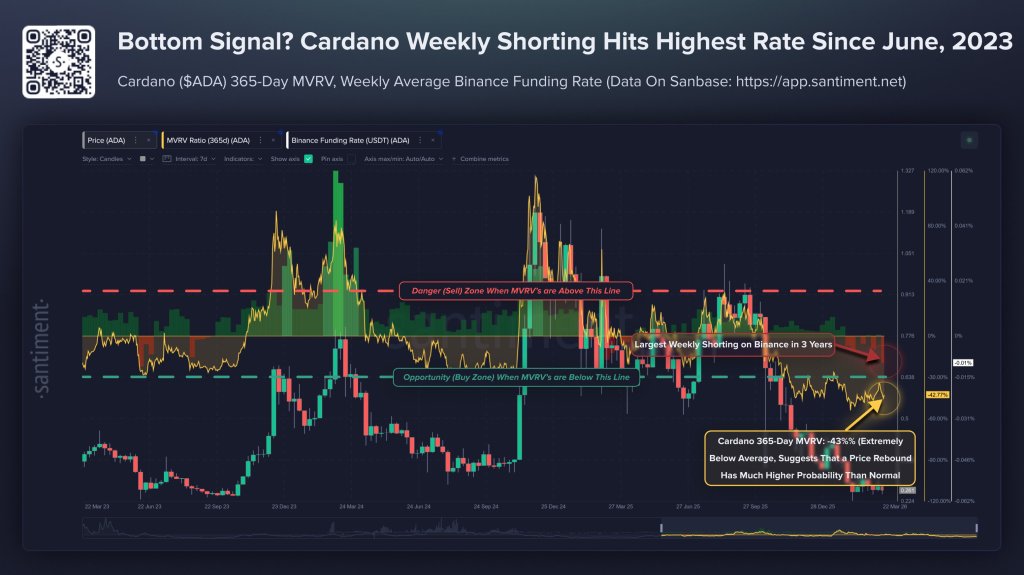
Cardano may be flashing the kind of contrarian setup that traders tend to watch closely near exhausted selloffs. According to on-chain and derivatives data shared by Santiment, ADA’s 365-day MVRV has fallen to -43% while Binance funding shows the highest imbalance toward shorts since June 2023, a combination the analytics firm argues has historically aligned with bottoming conditions. Is The Cardano (ADA) Bottom Near? Santiment’s core thesis is that Cardano holders who have been active over the past year are now deeply underwater, which changes the risk-reward profile for new buyers. “Average wallets that have been active on the Cardano network over the past year are netting a return of -43% on their investments,” the firm wrote on X. “Memes aside about the altcoin’s major -71% price decline since September, this extreme negative MVRV value is generally an indicator of $ADA being in an ‘opportunity’ or ‘buy’ zone.” Related Reading: Cardano Chop Nearing End? Here’s The Key Resistance To Watch That argument rests on how Santiment interprets MVRV, or the gap between market value and realized value, across a 365-day window. In its framing, when the average participant is sitting on severe unrealized losses, downside risk begins to compress because weaker positioning has already been flushed out. The chart shared by the firm marks sub-zero MVRV territory as an “opportunity” zone and places ADA’s current reading well inside it. Santiment pushed that point further with a more explicit contrarian read. “In a zero-sum game, when average returns are severely negative, this is an indication of a looming turnaround with coins always averaging 0% on MVRV’s (average trading returns) across any timeframe. So when other traders are in severe pain, key stakeholders and professional traders are intrigued by this due to the lowered risk of buying or adding on to their positions.” That does not mean a rebound is guaranteed, but it does clarify the logic behind the call. The signal is less about immediate momentum and more about market structure: if most recent participants are already trapped at a loss, marginal selling pressure can start to weaken while value-focused buyers step in. Related Reading: Cardano Could Rocket 1,000% From Extended Accumulation Area, Analyst Says The second piece of the setup comes from the perpetual futures market. Santiment said Cardano’s funding rate on Binance is now showing the largest ratio of shorts to longs since June 2023, indicating that traders are leaning heavily toward further downside. In crowded positioning regimes, that can matter as much as the spot chart itself. “Cardano’s funding rate on Binance is seeing the largest ratio of shorts (compared to longs) since June, 2023,” Santiment wrote. “Traders are clearly expecting that the #12 market cap will continue to decline in value. This historically is another bottom signal, as funding rates are always prone to liquidate and send prices in the direction that traders are expecting the least.” That last point is the real crux of the analysis. Santiment is not simply saying ADA looks cheap after a 71% slide since September. It is arguing that Cardano now sits at the intersection of two classic reversal ingredients: deeply negative holder returns and an overcrowded bearish derivatives trade. At press time, ADA traded at $0.2666. Featured image created with DALL.E, chart from TradingView.com

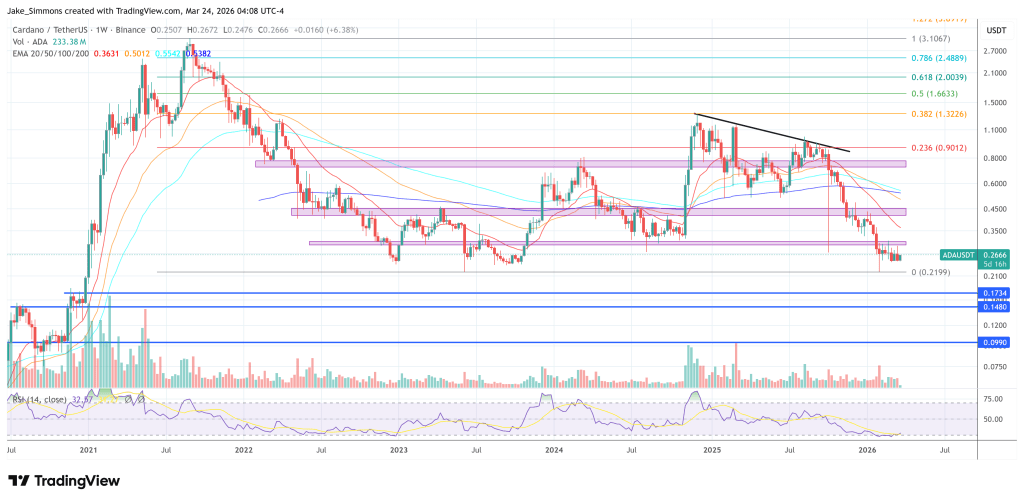
Cardano may be flashing the kind of contrarian setup that traders tend to watch closely near exhausted selloffs. According to on-chain and derivatives data shared by Santiment, ADA’s 365-day MVRV has fallen to -43% while Binance funding shows the highest imbalance toward shorts since June 2023, a combination the analytics firm argues has historically aligned with bottoming conditions.
Is The Cardano (ADA) Bottom Near?
Santiment’s core thesis is that Cardano holders who have been active over the past year are now deeply underwater, which changes the risk-reward profile for new buyers. “Average wallets that have been active on the Cardano network over the past year are netting a return of -43% on their investments,” the firm wrote on X. “Memes aside about the altcoin’s major -71% price decline since September, this extreme negative MVRV value is generally an indicator of $ADA being in an ‘opportunity’ or ‘buy’ zone.”
That argument rests on how Santiment interprets MVRV, or the gap between market value and realized value, across a 365-day window. In its framing, when the average participant is sitting on severe unrealized losses, downside risk begins to compress because weaker positioning has already been flushed out. The chart shared by the firm marks sub-zero MVRV territory as an “opportunity” zone and places ADA’s current reading well inside it.
Santiment pushed that point further with a more explicit contrarian read. “In a zero-sum game, when average returns are severely negative, this is an indication of a looming turnaround with coins always averaging 0% on MVRV’s (average trading returns) across any timeframe. So when other traders are in severe pain, key stakeholders and professional traders are intrigued by this due to the lowered risk of buying or adding on to their positions.”
That does not mean a rebound is guaranteed, but it does clarify the logic behind the call. The signal is less about immediate momentum and more about market structure: if most recent participants are already trapped at a loss, marginal selling pressure can start to weaken while value-focused buyers step in.
The second piece of the setup comes from the perpetual futures market. Santiment said Cardano’s funding rate on Binance is now showing the largest ratio of shorts to longs since June 2023, indicating that traders are leaning heavily toward further downside. In crowded positioning regimes, that can matter as much as the spot chart itself.
“Cardano’s funding rate on Binance is seeing the largest ratio of shorts (compared to longs) since June, 2023,” Santiment wrote. “Traders are clearly expecting that the #12 market cap will continue to decline in value. This historically is another bottom signal, as funding rates are always prone to liquidate and send prices in the direction that traders are expecting the least.”
That last point is the real crux of the analysis. Santiment is not simply saying ADA looks cheap after a 71% slide since September. It is arguing that Cardano now sits at the intersection of two classic reversal ingredients: deeply negative holder returns and an overcrowded bearish derivatives trade.
At press time, ADA traded at $0.2666.
What's Your Reaction?