


Cohance Lifesciences Makes A Cup & Handle Pattern Hinting At a Potential Bullish Breakout
Synopsis:Cohance Lifesciences Ltd has developed a cup-and-handle pattern on the daily chart, indicating a bullish continuation or trend reversal. The cup-and-handle pattern indicates a steady recovery followed by a brief consolidation, signalling that buyers are absorbing supply before a potential bullish breakout. The cup-and-handle pattern features a rounded recovery (the cup) followed by a shallow, […] The post Cohance Lifesciences Makes A Cup & Handle Pattern Hinting At a Potential Bullish Breakout appeared first on Trade Brains.


Synopsis:Cohance Lifesciences Ltd has developed a cup-and-handle pattern on the daily chart, indicating a bullish continuation or trend reversal.
The cup-and-handle pattern indicates a steady recovery followed by a brief consolidation, signalling that buyers are absorbing supply before a potential bullish breakout. The cup-and-handle pattern features a rounded recovery (the cup) followed by a shallow, downward-sloping consolidation (the handle).
On 27th April 2026, Cohance Lifesciences Ltd broke above the resistance neckline of a cup & handle pattern on the daily chart. A sustained move above Rs 403 could pave the way for further upside, while a drop below this level may weaken the bullish outlook.
In a cup-and-handle pattern, targets are typically set at the next key resistance level or estimated by projecting the depth of the cup upward from the breakout point. Traders generally trail profits while monitoring for a volume surge to confirm the strength of the bullish continuation.
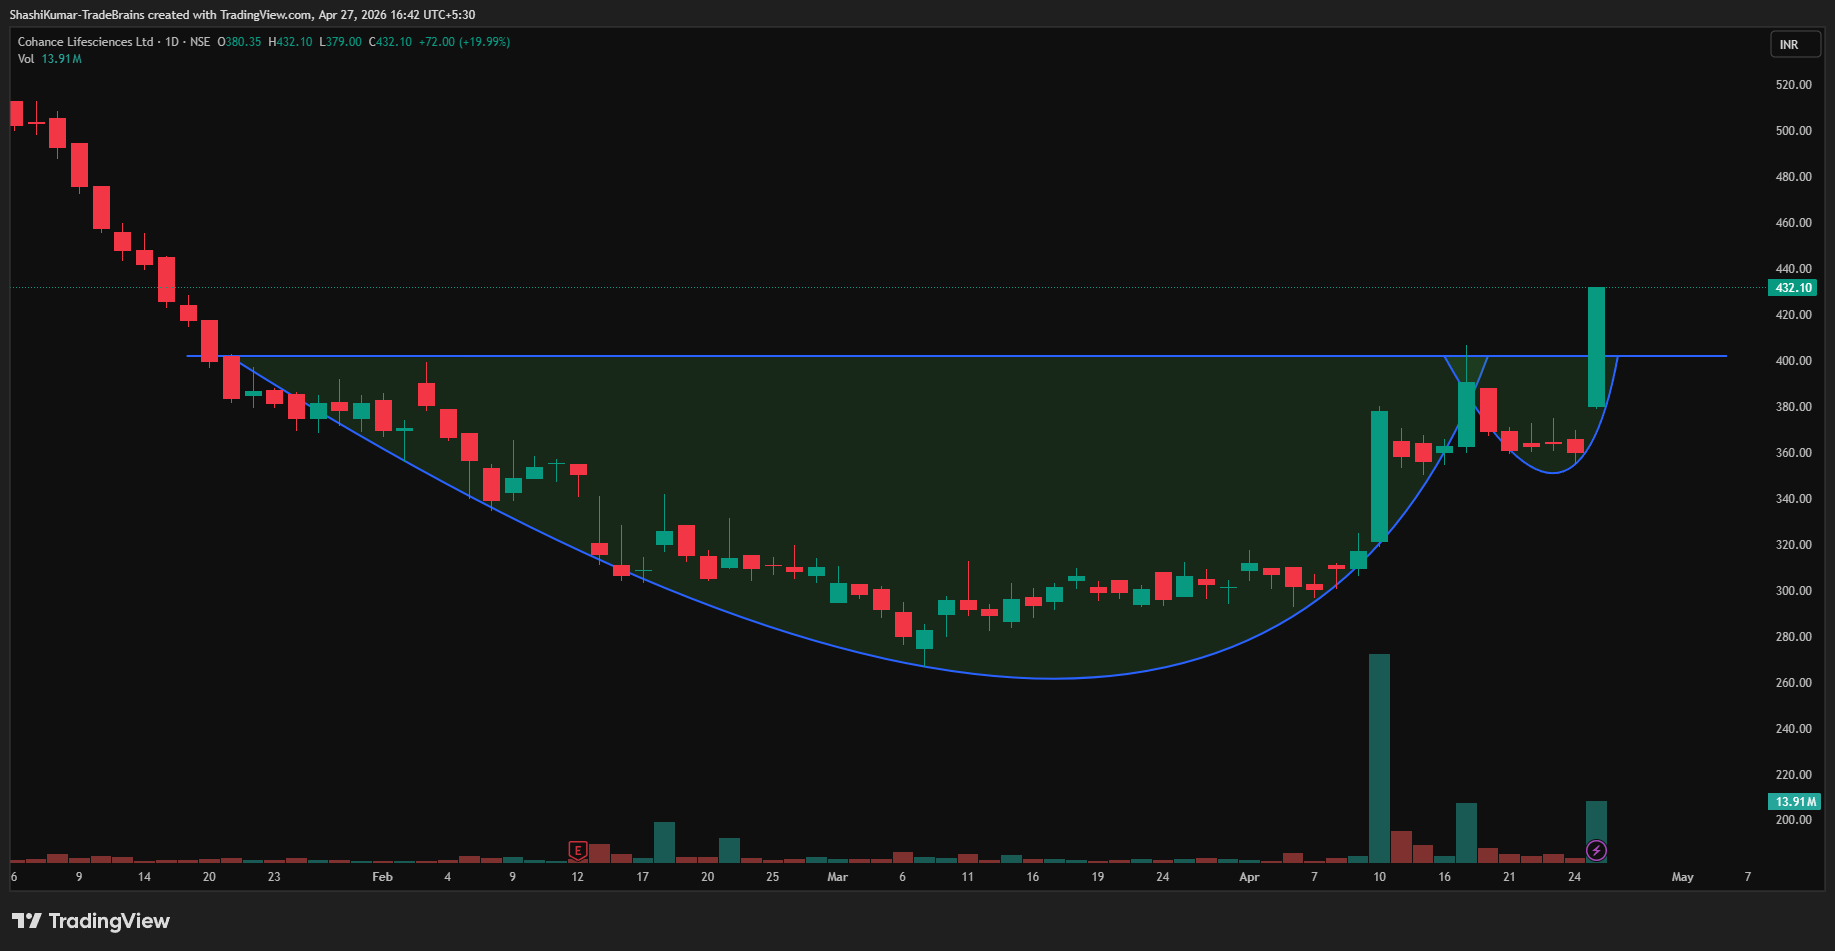
Cohance Lifesciences Ltd Chart: Daily Timeframe
Indicator Confirmation
- RSI: The daily RSI indicates bullish momentum, as it rose from 58.35 in the previous trading session to 73.61 on Monday.
- MACD: On the daily time frame, the blue MACD line was above the orange signal line, with the histogram turning green, indicating bullish momentum.
- Moving Averages: On the daily time frame, the 5-day moving average was above the 9-day moving average, further confirming a bullish trend.
- Price Volume Trend: The Price Volume Indicator confirms the uptrend, accompanied by a sharp increase in buying volume in the daily time frame.
Implications
The cup & handle pattern indicates a potential upward move. Holding above the Rs 403 support level, backed by strong volumes, would reinforce bullish momentum in the near term.
Cohance Lifesciences Limited is a technology-driven, integrated global CDMO platform providing comprehensive development and manufacturing solutions, including complex APIs, high-potency compounds, ADCs, oligonucleotides, and advanced intermediates, to leading innovator and generic pharmaceutical customers. With specialised capabilities in multi-step synthesis and flow chemistry, the company delivers high-quality, scalable solutions in regulated markets worldwide.
Over the past month, Cohance Lifesciences Ltd has surged 42.75%. Over a six-month period, the stock has dropped 49.19%, and on a year-over-year basis, it is down 59.56%. For more such technical stock ideas, clickhereto view our research page.
Disclaimer: The views and investment tips expressed by investment experts/broking houses/rating agencies on tradebrains.in are their own, and not that of the website or its management. Investing in equities poses a risk of financial losses. Investors must therefore exercise due caution while investing or trading in stocks. Trade Brains Technologies Private Limited or the author are not liable for any losses caused as a result of the decision based on this article. Please consult your investment advisor before investing.
The post Cohance Lifesciences Makes A Cup & Handle Pattern Hinting At a Potential Bullish Breakout appeared first on Trade Brains.
What's Your Reaction?