


Double Bottom Pattern: Energy Stock Signals Near-Term Bullish Reversal
Synopsis: Mahanagar Gas Ltd has formed a double bottom pattern on the 2-hour chart, indicating a potential near-term bullish reversal. The emergence of a double bottom pattern following a prolonged decline highlights a strong defence by buyers at lower levels. A breakout above the neckline signals a potential bullish reversal. Mahangar Gas Chart: 2-hour Timeframe […] The post Double Bottom Pattern: Energy Stock Signals Near-Term Bullish Reversal appeared first on Trade Brains.


Synopsis: Mahanagar Gas Ltd has formed a double bottom pattern on the 2-hour chart, indicating a potential near-term bullish reversal.
The emergence of a double bottom pattern following a prolonged decline highlights a strong defence by buyers at lower levels. A breakout above the neckline signals a potential bullish reversal.
Mahangar Gas Chart: 2-hour Timeframe
The double bottom pattern reflects a potential trend reversal after a decline, where prices form two similar lows near a support zone. A decisive breakout above the neckline signals strengthening buying interest, suggesting sellers are losing control, and upside momentum could build.
On Tuesday’s session, Mahanagar Gas Ltd sustained above the neckline after forming a double bottom pattern. The move, supported by improving buying interest, indicates emerging near-term bullish momentum. Continued holding above this level could strengthen upside prospects and confirm the reversal signal.
In a double bottom setup, upside targets are typically measured using immediate resistance levels above the neckline. Traders often use these zones to book partial or full profits while closely monitoring price action for continuation or signs of exhaustion.
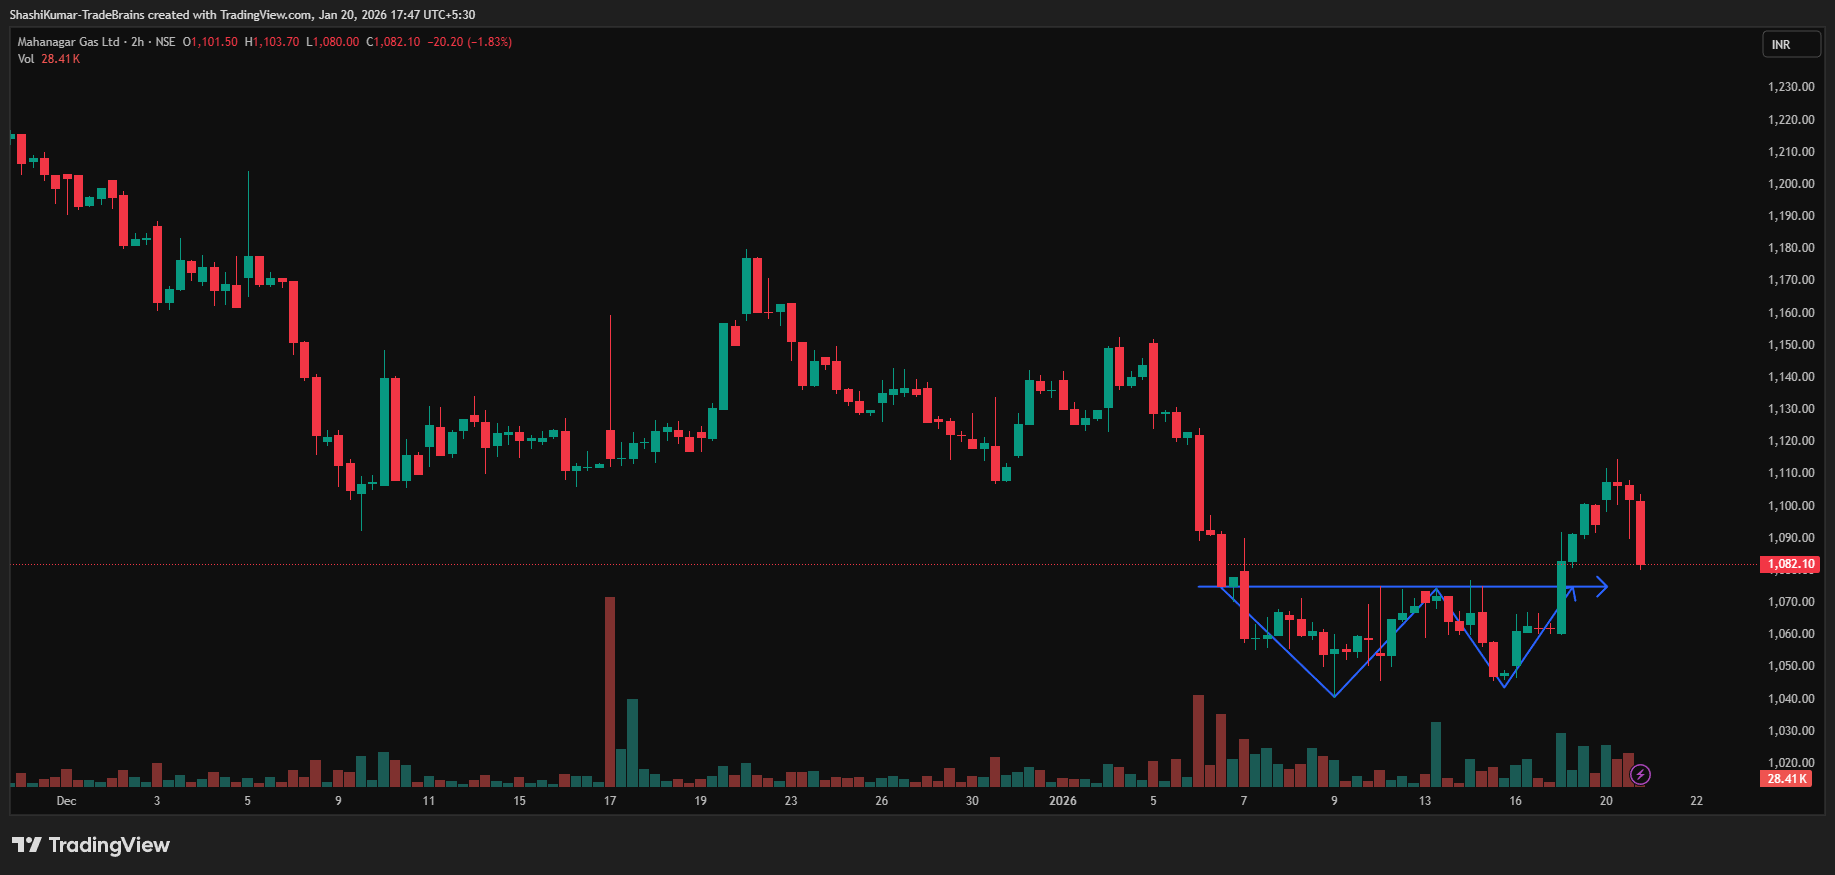
(Source: Mahangar Gas, Tradingview)
Indicator Confirmation
- RSI: The daily RSI remained flat amid heightened volatility. After recovering from 40 last Friday session to 47 on Monday, the RSI remained flat on Tuesday due to geopolitical uncertainty and broader index volatility.
- MACD: The Blue MACD line crossed above the orange signal line, with the histogram turning green, indicating bullish momentum.
- Moving Averages: On the 2-hour time frame, the 5-day moving average has crossed above the 9-day moving average, further confirming a bullish trend.
- Price Volume Trend: The Price Volume Indicator confirmed the neutral trend, as volume activity remained flat and lacked strong directional conviction.
Implications
The formation of a double bottom suggests scope for further upside. A sustained close above the key Rs 1,060 support, ideally accompanied by improved buying volume, would validate the reversal and reduce the risk of a false breakout. The former resistance near Rs 1,060 has now turned into immediate support, and continued trading above this level would strengthen bullish control in the near term.
About the stock
Mahanagar Gas Limited (MGL) is one of India’s largest City Gas Distribution companies, boasting over 30 years of consistent growth. Operating across a 45,691 sq km area including Mumbai, Thane, and Raigad, their extensive infrastructure features an 8,062 km pipeline network and 485 CNG stations. Their primary offerings include Compressed Natural Gas (CNG) for over 1.22 million vehicles and Piped Natural Gas (PNG) for approximately 2.95 million households and 5,340 industrial/commercial customers.
Over the past month, Mahanagar Gas Ltd has slipped 6.87%, indicating persistent weakness. The stock has declined 28.52% over the past six months and remains down 17.30% on a year-on-year basis.
Disclaimer: The views and investment tips expressed by investment experts/broking houses/rating agencies on tradebrains.in are their own, and not that of the website or its management. Investing in equities poses a risk of financial losses. Investors must therefore exercise due caution while investing or trading in stocks. Trade Brains Technologies Private Limited or the author are not liable for any losses caused as a result of the decision based on this article. Please consult your investment advisor before investing.
The post Double Bottom Pattern: Energy Stock Signals Near-Term Bullish Reversal appeared first on Trade Brains.
What's Your Reaction?