


Head and Shoulders Pattern: Aditya Birla Group Stock with Short-Term Bearishness Ahead
Synopsis: Grasim Industries Ltd has exhibited a bearish reversal pattern on its 1‑hour chart. The stock has formed a head and shoulders, signalling potential near-term downward momentum. Grasim Industries, after experiencing a prolonged uptrend in recent trading sessions, has formed a head-and-shoulders pattern in a one-hour chart pattern, signalling a potential bearish reversal. (1-Hour Timeframe) […] The post Head and Shoulders Pattern: Aditya Birla Group Stock with Short-Term Bearishness Ahead appeared first on Trade Brains.


Synopsis: Grasim Industries Ltd has exhibited a bearish reversal pattern on its 1‑hour chart. The stock has formed a head and shoulders, signalling potential near-term downward momentum.
Grasim Industries, after experiencing a prolonged uptrend in recent trading sessions, has formed a head-and-shoulders pattern in a one-hour chart pattern, signalling a potential bearish reversal.
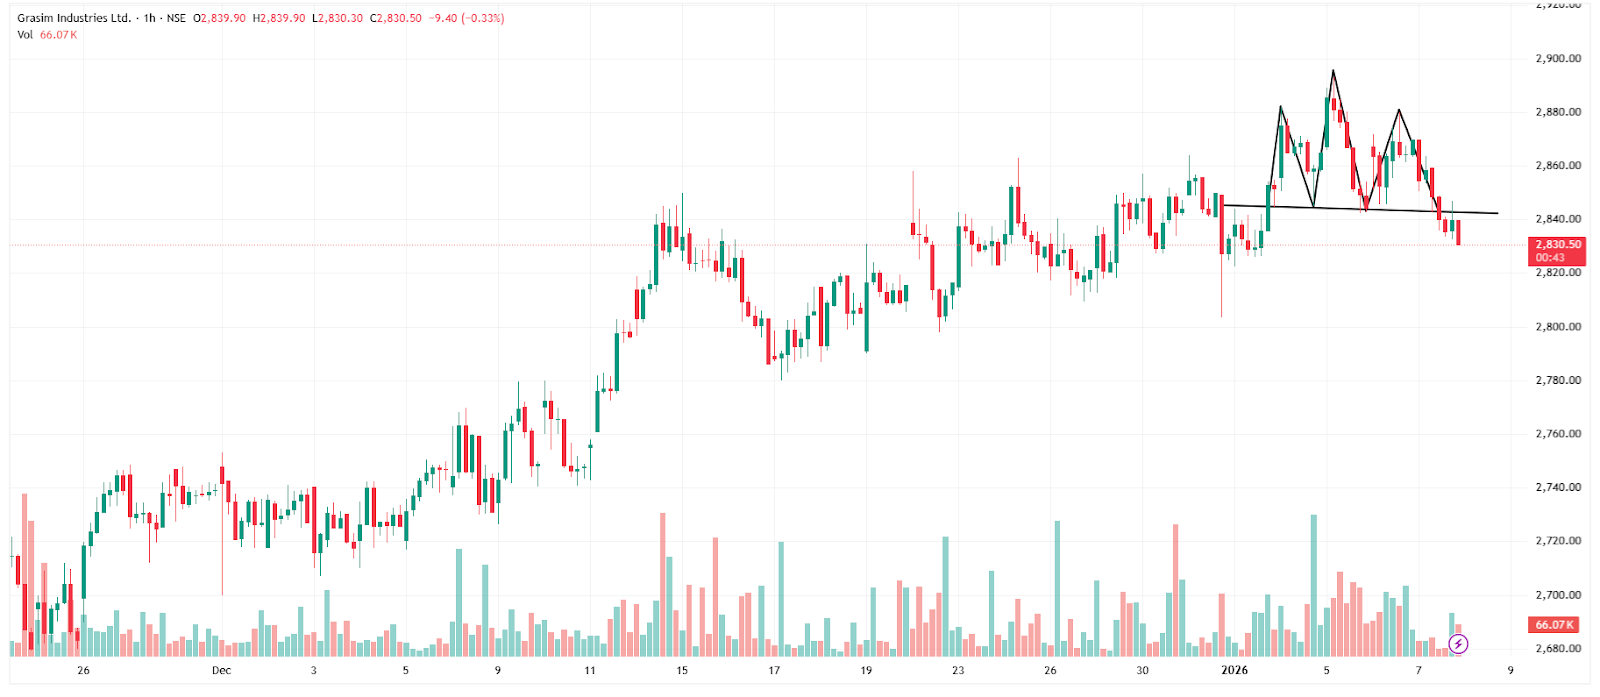
(1-Hour Timeframe)
The head and shoulders is a classic bearish reversal pattern, marked by a higher central peak (the head) flanked by two lower peaks (the shoulders). This formation signals a potential shift from an uptrend to a downtrend once the price breaks below the neckline.
On Wednesday, the stock formed a lower-high structure around the shoulders and head and then broke below the Rs 2,845 neckline. This breakdown, along with slightly declining buying volumes, indicates confirmation of near-term bearish momentum.
The downside target for this pattern is typically calculated by measuring the distance between the highest point of the pattern (the head) and the neckline, and then projecting that distance downward from the point of breakdown. When the price approaches this projected level, traders often consider booking profits or reassessing their positions.
Indicator Confirmation
- RSI: The daily RSI shows persistent bearish momentum, as it dropped from 65 in the last trading session to 55 on Wednesday, confirming the continuation of the downtrend.
- MACD: The orange signal line crossed above the Blue MACD line, with the histogram turning red, indicating bearish momentum.
- Moving Averages: On the 1-hour time frame, the 5-day moving average has crossed below the 9-day moving average, further confirming a bearish trend.
- Price Volume Trend: The Price Volume Indicator confirms the trend, supported by a sharp decline in trading volume.
Implications
This bearish head and shoulders breakdown suggests the possibility of further downside momentum. A decisive close below the neckline support, ideally accompanied by higher volumes, is required to confirm the move and reduce the risk of a false breakdown. On the upside, resistance is expected around Rs 2,850, while sustained trading below the breakdown zone would indicate continued bearish pressure.
About the stock
Grasim Industries Limited, founded in 1947, operates as a diversified conglomerate with a presence across fibres, chemicals, building materials, and financial services. Its building materials portfolio includes UltraTech Cement with 192.3 MnTPA grey capacity (targeting 240.8 MnTPA by FY28), Birla Opus Paints with 24% share of organised market capacity, and Birla Pivot offering over 40,000 SKUs. The company also has 1.93 GWp of renewable energy capacity and uses 24% renewable power across operations.
Over the past month, Grasim Industries Ltd has delivered a return of 3.31% after a prolonged upward trend. Previously, the stock gained 1.87% over six months and surged 14.88% over the past year.
For more such technical stock ideas, Click here to view our research page.
Disclaimer: The views and investment tips expressed by investment experts/broking houses/rating agencies on tradebrains.in are their own, and not that of the website or its management. Investing in equities poses a risk of financial losses. Investors must therefore exercise due caution while investing or trading in stocks. Trade Brains Technologies Private Limited or the author are not liable for any losses caused as a result of the decision based on this article. Please consult your investment advisor before investing.
The post Head and Shoulders Pattern: Aditya Birla Group Stock with Short-Term Bearishness Ahead appeared first on Trade Brains.
What's Your Reaction?