


IFCI Ltd Forms a Symmetrical Triangle Pattern Signalling at a Potential Short-Term Bullish Breakout
Synopsis: IFCI Ltd has formed a symmetrical triangle on the 1-week chart, signalling a possible short-term bullish breakout. A symmetrical triangle is a neutral chart pattern formed by converging trendlines connecting higher lows and lower highs. A breakout above the resistance line signals strengthening buying momentum and the potential continuation of a bullish trend. The […] The post IFCI Ltd Forms a Symmetrical Triangle Pattern Signalling at a Potential Short-Term Bullish Breakout appeared first on Trade Brains.


Synopsis: IFCI Ltd has formed a symmetrical triangle on the 1-week chart, signalling a possible short-term bullish breakout.
A symmetrical triangle is a neutral chart pattern formed by converging trendlines connecting higher lows and lower highs. A breakout above the resistance line signals strengthening buying momentum and the potential continuation of a bullish trend.
The chart shows a confirmed bullish breakout above the resistance neckline. Supported by volume surge and points to a potential short-term upward move. IFCI Ltd moved above the key resistance level of Rs 64 on 27th May, turning it into a strong support zone. The stock closed at Rs 68.53 on the 1-week chart on Friday and has continued to sustain above the Rs 64 level till date, indicating sustained bullish momentum and continued buying interest.
In a symmetrical triangle pattern, traders typically target the next resistance level or project a price move equal to the triangle’s widest height from the breakout point, while strong buying volume and positive momentum help confirm the bullish breakout.
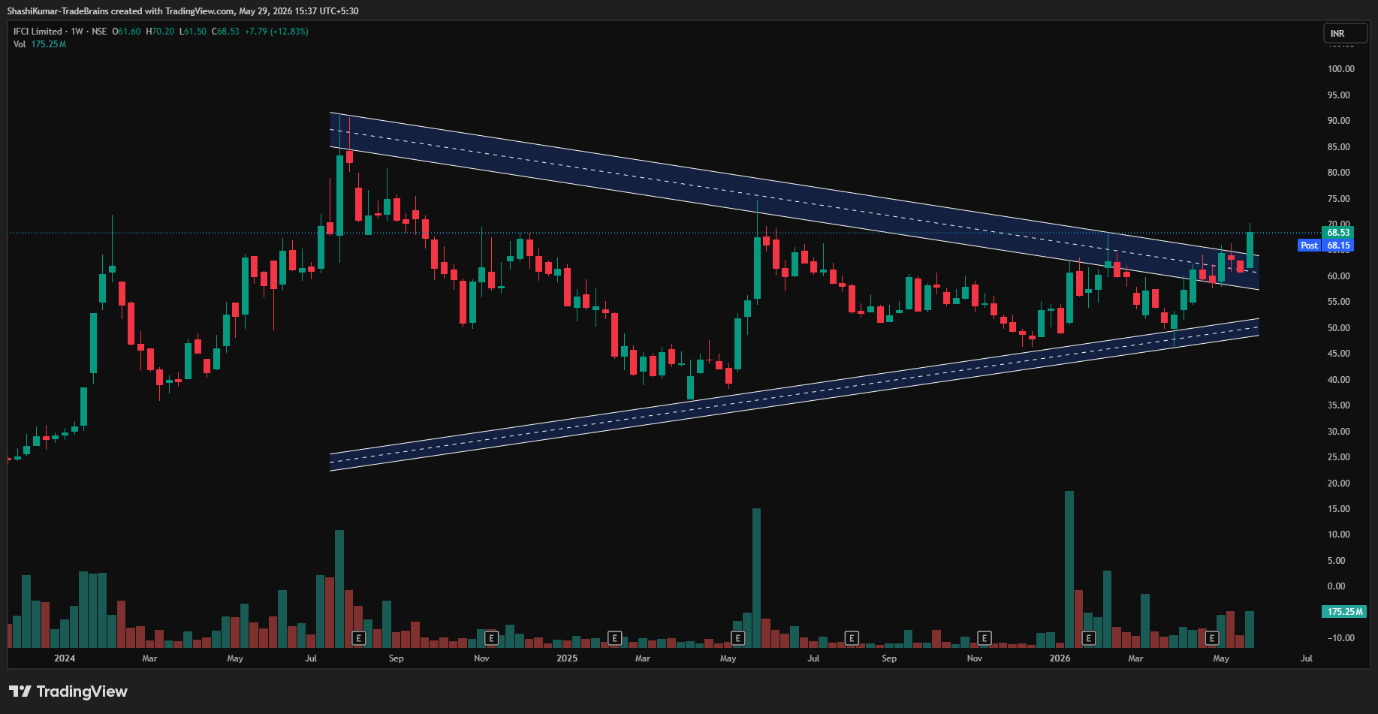
IFCI Ltd Chart: 1-week Timeframe
Indicator Confirmation
- RSI: The weekly RSI indicates buying pressure, as it rose from 54.28 in the previous week’s trading session to 62.15 this week.
- Price Volume Trend: The Price Volume Indicator confirms the uptrend, accompanied by an increase in buying volume in the weekly time frame.
- MACD: On the weekly time frame, the blue MACD line was above the orange signal line, with the histogram turning green, indicating bullish momentum.
- Moving Averages: On the weekly time frame, the 5-day EMA was above the 9-day EMA, further confirming a bullish trend.
Implications
The symmetrical triangle breakout indicates the resumption of an upward trend. Sustaining above the Rs 64 support level, along with strong trading volumes, could further strengthen the near-term bullish outlook.
About the stock
IFCI Limited is a government-owned financial institution and a systemically important non-deposit-taking NBFC. Established in 1948, it was India’s first Development Financial Institution (DFI) and plays a key role in supporting industrial and infrastructure development. Headquartered in New Delhi, IFCI provides financial assistance to sectors such as power, transport, telecom, manufacturing, and real estate while also implementing various government initiatives and development programmes across the country.
IFCI Limited has shown strong upward momentum, gaining 16.98% over the past month. The stock has also risen 32.66% in the last six months. However, on a year-over-year basis, it remains down 5.03%, despite the recent recovery in price performance. For more such technical stock ideas, click here to view our research page.
Disclaimer: The views and investment tips expressed by investment experts/broking houses/rating agencies on tradebrains.in are their own, and not that of the website or its management. Investing in equities poses a risk of financial losses. Investors must therefore exercise due caution while investing or trading in stocks. Trade Brains Technologies Private Limited or the author are not liable for any losses caused as a result of the decision based on this article. Please consult your investment advisor before investing.
The post IFCI Ltd Forms a Symmetrical Triangle Pattern Signalling at a Potential Short-Term Bullish Breakout appeared first on Trade Brains.
What's Your Reaction?


