


SBI Cards Forms A Morning Star Pattern Hinting At A Short-Term Bullish Reversal
Synopsis: SBI Cards & Payment Services Ltd in the weekly chart displays a morning star pattern, hinting at a short-term bullish reversal. The Morning Star pattern indicates a shift in momentum, with buyers regaining control after recent weakness. A small-bodied candle sandwiched between a bearish candle and a strong bullish candle highlights a shift in […] The post SBI Cards Forms A Morning Star Pattern Hinting At A Short-Term Bullish Reversal appeared first on Trade Brains.

Synopsis: SBI Cards & Payment Services Ltd in the weekly chart displays a morning star pattern, hinting at a short-term bullish reversal.
The Morning Star pattern indicates a shift in momentum, with buyers regaining control after recent weakness. A small-bodied candle sandwiched between a bearish candle and a strong bullish candle highlights a shift in market sentiment, signalling that buyers are reclaiming control.
On June 18, SBI Cards & Payment Services Ltd formed a Morning Star pattern on its weekly chart. A breakout above Rs 624.8 would signal further gains, whereas dropping back below this level will completely invalidate the bullish outlook.
Traders typically aim for the nearest overhead resistance levels, locking in or trailing profits as the price climbs. By monitoring volume and momentum, they can spot signs of buying exhaustion and exit before the trend reverses.
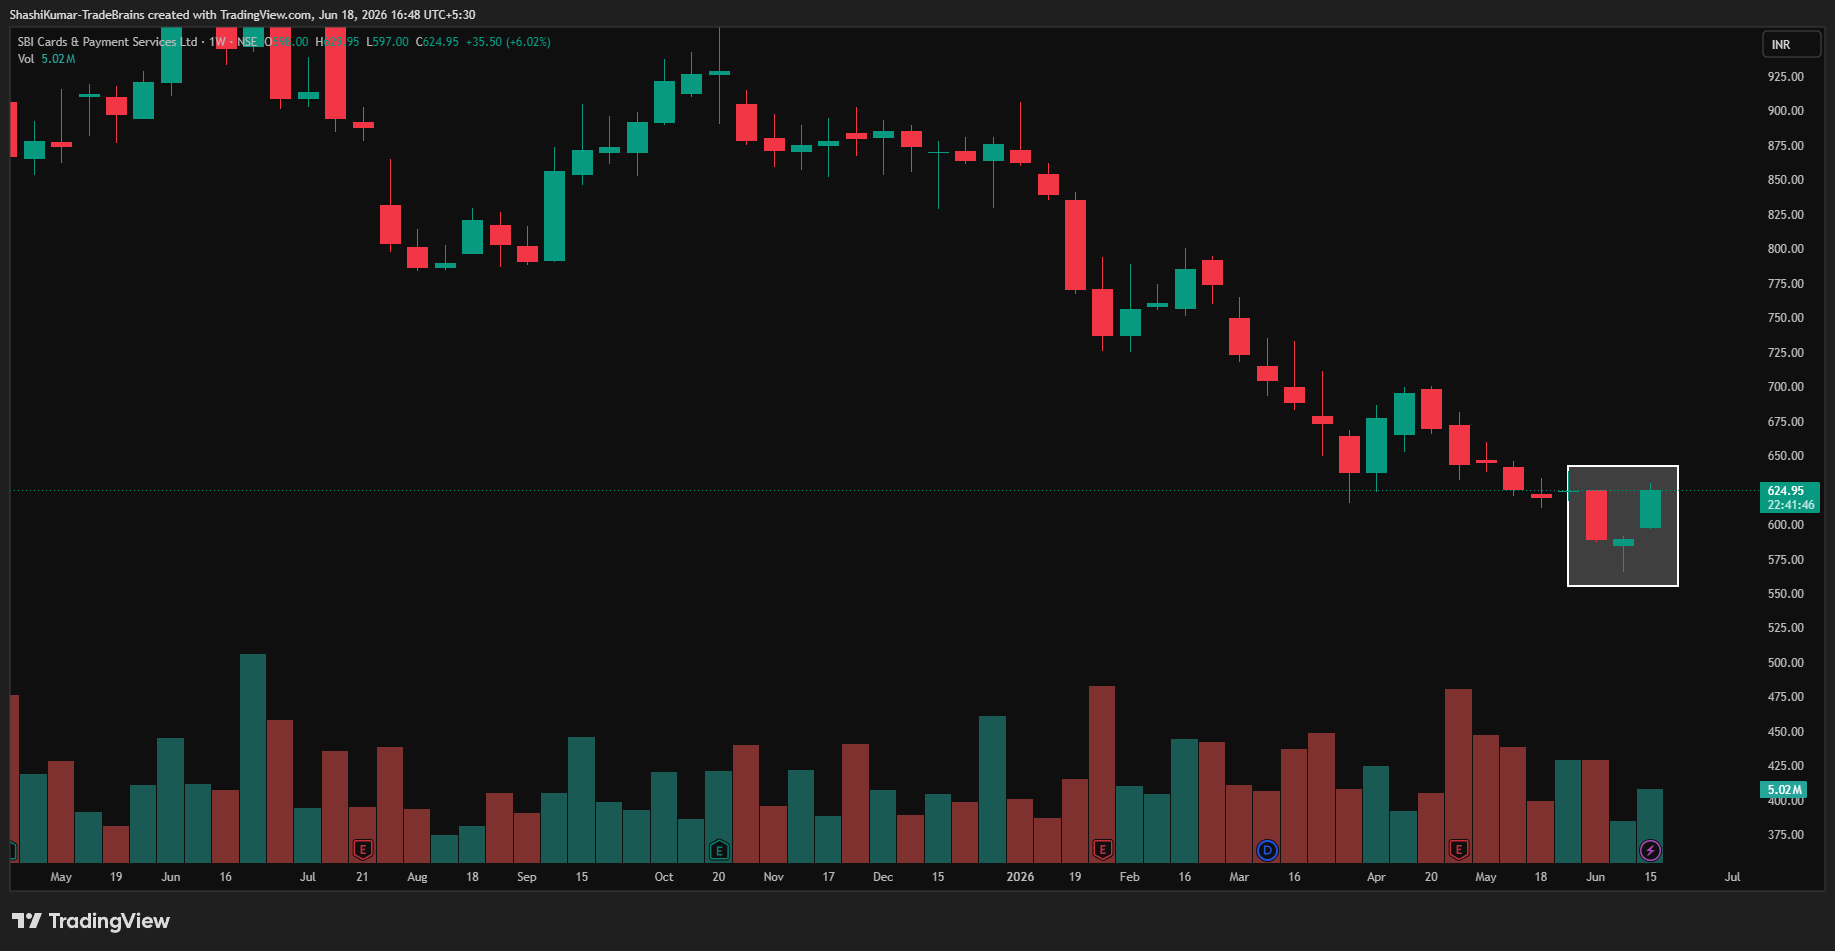
SBI Cards & Payment Services Ltd Chart: Weekly Timeframe
Indicator Confirmation
- RSI: The weekly RSI indicates buying momentum, as it rose from 26.27 in the previous week’s session to 35.65 on Thursday.
- Price Volume Trend: The Price Volume Indicator confirms the uptrend, accompanied by a sharp increase in buying volume in the weekly time frame.
Implications
A Morning Star pattern points to a potential upside for the stock. Securing a close above Rs 624.8 on high volume will confirm this bullish reversal and lower the risk of a false breakout signal.
About the stock
SBI Cards and Payment Services Limited is a non-banking financial company with a diverse portfolio of individual and corporate credit cards. Holding over 22.1 million cards in force as of March 2026, the company leverages a multi-channel acquisition network to serve customers across all income profiles and lifestyles.
SBI Cards & Payment Services Ltd flatlined over the past month, up just 0.05%. However, the stock’s longer-term performance remains weak, down 26.36% over the last six months and 35.77% year-over-year. For more such technical stock ideas, clickhereto view our research page.
Disclaimer: The views and investment tips expressed by investment experts/broking houses/rating agencies on tradebrains.in are their own, and not that of the website or its management. Investing in equities poses a risk of financial losses. Investors must therefore exercise due caution while investing or trading in stocks. Trade Brains Technologies Private Limited or the author are not liable for any losses caused as a result of the decision based on this article. Please consult your investment advisor before investing.
The post SBI Cards Forms A Morning Star Pattern Hinting At A Short-Term Bullish Reversal appeared first on Trade Brains.
What's Your Reaction?