


Stock Breakout: Max Financial Services share signals a short-term bullish trend
Synopsis: Max Financial Services Ltd has broken out of a descending channel on the 4-hour chart, signalling a short-term bullish trend. Max Financial Services Ltd, after a phase of controlled decline in recent sessions, has formed a descending channel pattern. The descending channel pattern reflects a short-term downtrend, with prices moving between parallel downward-sloping support […] The post Stock Breakout: Max Financial Services share signals a short-term bullish trend appeared first on Trade Brains.


Synopsis: Max Financial Services Ltd has broken out of a descending channel on the 4-hour chart, signalling a short-term bullish trend.
Max Financial Services Ltd, after a phase of controlled decline in recent sessions, has formed a descending channel pattern. The descending channel pattern reflects a short-term downtrend, with prices moving between parallel downward-sloping support and resistance levels. A decisive breakout above the upper boundary signals a bullish reversal, suggesting buyers are gaining control and upside momentum may strengthen.
On 8th April 2026, Max Financial Services Ltd broke above the descending channel above the key resistance level of Rs 1,500, sustaining the move through 9th & 10th April 2026. The breakout, backed by healthy volumes, indicates emerging near-term bullish momentum.
For an upside breakout from a descending channel, targets are usually set at nearby resistance levels, where traders may book profits while watching for further strength or reversal signals.
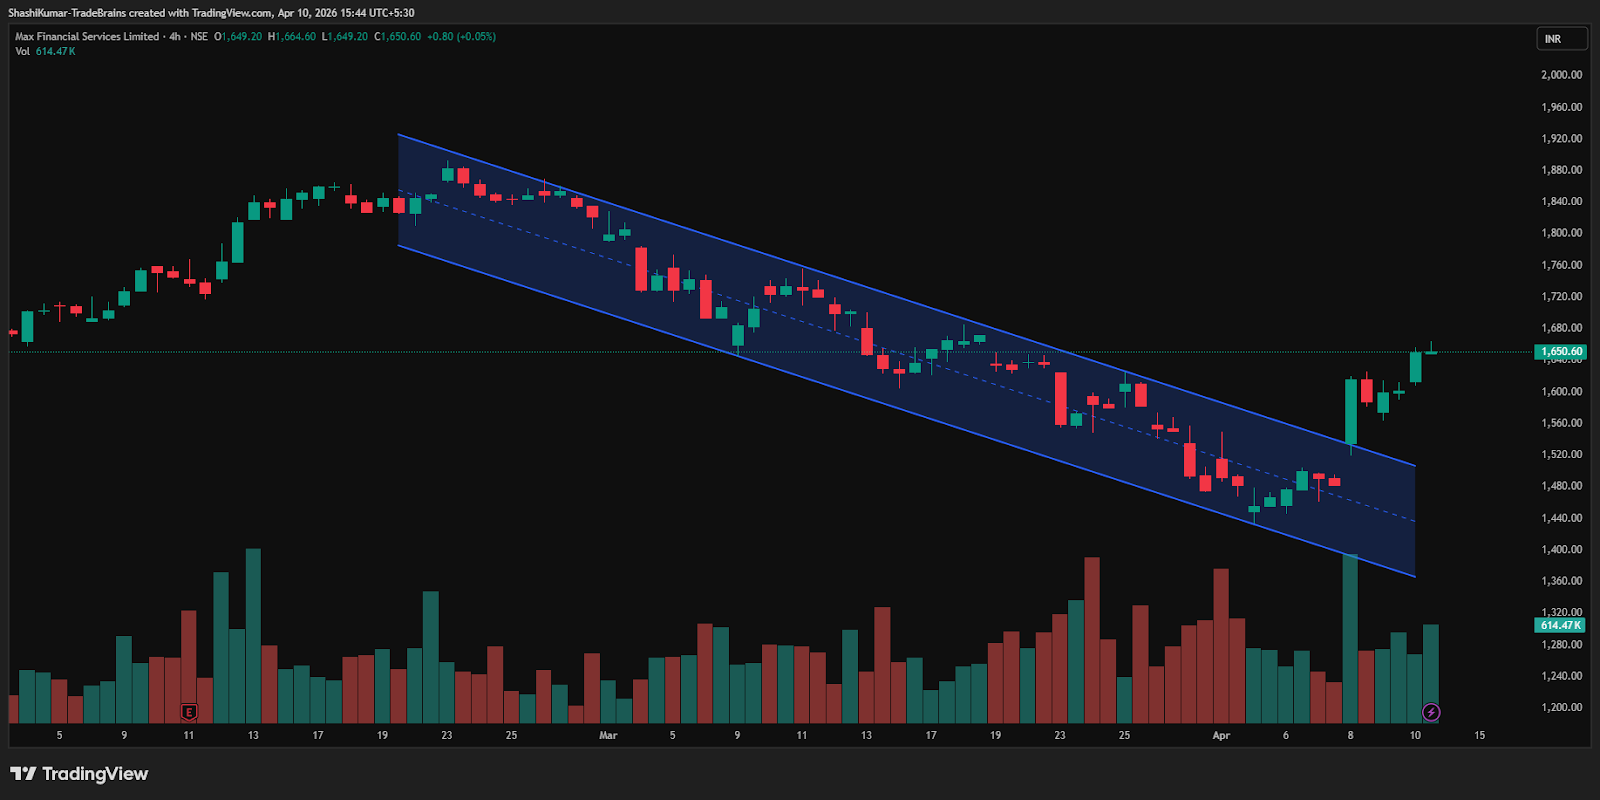
Max Financial Services Ltd Chart: 4-hour Timeframe
Indicator Confirmation
RSI: The daily RSI indicates bullish momentum, as it rose from 49.08 in the previous trading session to 54.62 on Friday.
MACD: On the daily time frame, the blue MACD line was above the orange signal line, with the histogram turning green, indicating bullish momentum.
Moving Averages: On the daily time frame, the 5-day moving average has crossed above the 9-day moving average, further confirming a bullish trend.
Price Volume Trend: The Price Volume Indicator confirms the uptrend, accompanied by a sharp increase in buying volume in the daily time frame.
Implications
A breakout from the descending channel suggests upside potential. A sustained close above the Rs 1500 level with strong volume would confirm it and lower false-breakout risk. Rs 1500 now acts as immediate support, and holding above it keeps the short-term trend bullish.
About the stock
Max Financial Services Limited (MFSL) is part of one of India’s leading conglomerates, the Max Group. Focused on life insurance, MFSL owns and actively manages an 81% majority stake in Axis Max Life Insurance. The company has built a strong distribution network, with over 12,200 partner branches and around 154,000 agents.
Over the past month, shares of Max Financial Services Ltd have fallen by 4.77%. Despite this short-term dip, the stock has risen 4.36% over the past six months and delivered a strong 41.89% gain over the past year. For more such technical stock ideas, click here to view our research page.
Disclaimer: The views and investment tips expressed by investment experts/broking houses/rating agencies on tradebrains.in are their own, and not that of the website or its management. Investing in equities poses a risk of financial losses. Investors must therefore exercise due caution while investing or trading in stocks. Trade Brains Technologies Private Limited or the author are not liable for any losses caused as a result of the decision based on this article. Please consult your investment advisor before investing.
The post Stock Breakout: Max Financial Services share signals a short-term bullish trend appeared first on Trade Brains.
What's Your Reaction?