


XRP Chart History Sparks Speculation Of $8.6 Price Target
A single historical parallel is driving one analyst’s bold call on XRP — and it hinges on a rally that hasn’t happened yet. Related Reading: Ghana’s Crypto Push Begins As 11 Companies Enter SEC Sandbox Channel Pattern Tracks 9 Months Of Price Action Chartist Celal Kucuker has mapped out a descending channel that has guided XRP’s price movements since the token hit a record high of $3.6 in July 2025. The channel has two boundaries: a lower trendline that dates back even further — to when XRP pulled back from $3.4 in January 2025 — and an upper trendline that formed after the July peak. Together, they’ve boxed in the token’s price for the better part of nine months. Two of Kucuker’s projected targets within that channel have already been hit. XRP climbed to $2.4 in January 2026, touching the upper trendline, then reversed and fell to $1.1 in early February, landing near the lower boundary. Both moves played out largely as the analyst had outlined. XRP is now trading around $1.41, down 24% since the start of the year. Ripple XRP 2.40$ ☑️ 1.10$ ☑️ 1.80$ ⌛️ 0.90$ ⌛️ 8.60$ ⌛️ September – December pic.twitter.com/dFilurLCVC — Celal Kucuker (@CelalKucuker) March 13, 2026 Two More Moves Before A Potential Breakout According to Kucuker’s roadmap, the price action isn’t done yet. He expects XRP to bounce toward $1.8 — a retest of the upper trendline — before pulling back again to around $0.9, which would mark another touch of the lower boundary and potentially push the token below the $1 mark. Only after that final retest, in his view, does the setup for a breakout emerge. When that breakout comes, Kucuker puts the upside target at $8.6. He projects that move to unfold between September and December 2026. From the estimated breakout price, that would represent a gain of 330%. That percentage isn’t arbitrary. It mirrors what XRP did the last time it broke out of a similar structure. After clearing a comparable descending channel in November 2024, the token climbed 330% to reach $3.4 by January 2025. The current projection applies that same multiplier to the new setup. Broader Market Adds To Uncertainty The crypto market hasn’t made things easy. Reports indicate the global crypto market cap has dropped 18% since January, falling to roughly $2.4 trillion. XRP’s losses have outpaced that decline. Related Reading: Bitcoin Climbs Back To $73,000 As Short Squeeze Wipes Out $246M In Futures Bets None of that, on its own, derails a technical forecast built on chart patterns rather than macro conditions. But the scale of the projected move — from a potential low near $0.9 to a target of $8.6 — would require sustained buying pressure over several months, with few major disruptions along the way. Kucuker has not specified a timeline for the near-term moves to $1.8 and $0.9. Those steps are treated as preconditions, not endpoints. The $8.6 figure only comes into play after the channel is broken to the upside. As of March 14, XRP continues to trade well within the channel’s boundaries, with the next key level — the $1.8 upper trendline retest — still ahead. Featured image from Shutterstock, chart from TradingView

A single historical parallel is driving one analyst’s bold call on XRP — and it hinges on a rally that hasn’t happened yet.
Channel Pattern Tracks 9 Months Of Price Action
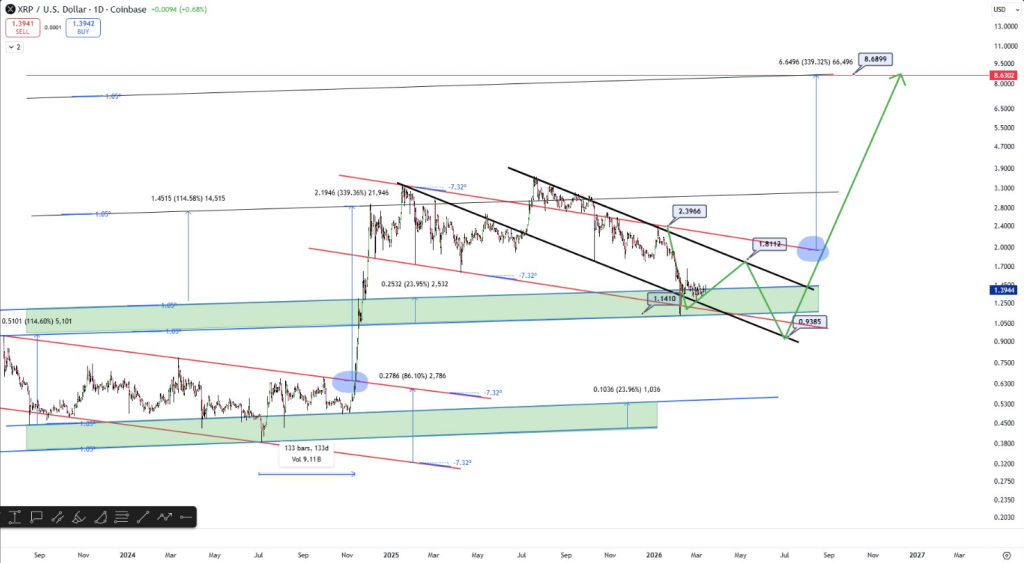
Chartist Celal Kucuker has mapped out a descending channel that has guided XRP’s price movements since the token hit a record high of $3.6 in July 2025.
The channel has two boundaries: a lower trendline that dates back even further — to when XRP pulled back from $3.4 in January 2025 — and an upper trendline that formed after the July peak. Together, they’ve boxed in the token’s price for the better part of nine months.
Two of Kucuker’s projected targets within that channel have already been hit. XRP climbed to $2.4 in January 2026, touching the upper trendline, then reversed and fell to $1.1 in early February, landing near the lower boundary. Both moves played out largely as the analyst had outlined.
XRP is now trading around $1.41, down 24% since the start of the year.
Ripple XRP
2.40$
1.10$
0.90$
— Celal Kucuker (@CelalKucuker) March 13, 2026
Two More Moves Before A Potential Breakout
According to Kucuker’s roadmap, the price action isn’t done yet. He expects XRP to bounce toward $1.8 — a retest of the upper trendline — before pulling back again to around $0.9, which would mark another touch of the lower boundary and potentially push the token below the $1 mark.
Only after that final retest, in his view, does the setup for a breakout emerge.
When that breakout comes, Kucuker puts the upside target at $8.6. He projects that move to unfold between September and December 2026. From the estimated breakout price, that would represent a gain of 330%.
That percentage isn’t arbitrary. It mirrors what XRP did the last time it broke out of a similar structure. After clearing a comparable descending channel in November 2024, the token climbed 330% to reach $3.4 by January 2025. The current projection applies that same multiplier to the new setup. Broader Market Adds To Uncertainty
The crypto market hasn’t made things easy. Reports indicate the global crypto market cap has dropped 18% since January, falling to roughly $2.4 trillion. XRP’s losses have outpaced that decline.
None of that, on its own, derails a technical forecast built on chart patterns rather than macro conditions. But the scale of the projected move — from a potential low near $0.9 to a target of $8.6 — would require sustained buying pressure over several months, with few major disruptions along the way.
Kucuker has not specified a timeline for the near-term moves to $1.8 and $0.9. Those steps are treated as preconditions, not endpoints. The $8.6 figure only comes into play after the channel is broken to the upside.
As of March 14, XRP continues to trade well within the channel’s boundaries, with the next key level — the $1.8 upper trendline retest — still ahead.
Featured image from Shutterstock, chart from TradingView
What's Your Reaction?