


XRP Price Stalls Again, Can Bulls Overcome Crucial Hurdles?
XRP price started a downside correction from the $1.4650 zone. The price is now consolidating and might aim for more gains if it stays above the $1.40 zone. XRP price started a fresh increase above the $1.420 zone. The price is now trading above $1.40 and the 100-hourly Simple Moving Average. There is a bullish trend line forming with support at $1.40 on the hourly chart of the XRP/USD pair (data source from Kraken). The pair could continue to move up if it settles above $1.4250. XRP Price Holds Support XRP price started a decent upward move above $1.4120 and $1.4250, like Bitcoin and Ethereum. The price gained pace for a clear move above the $1.450 resistance. A high was formed at $1.4650 and the price started a downside correction. There was a move below $1.450 and $1.440. The price dipped below the 61.8% Fib retracement level of the upward move from the $1.3612 swing low to the $1.4650 high. However, the bulls were active above $1.3850 and the 76.4% Fib retracement level of the upward move from the $1.3612 swing low to the $1.4650 high. The price is now trading above $1.40 and the 100-hourly Simple Moving Average. If there is a fresh upward move, the price might face resistance near the $1.4250 level. The first major resistance is near the $1.440 level, above which the price could rise and test $1.4650. A clear move above the $1.4650 resistance might send the price toward the $1.50 resistance. Any more gains might send the price toward the $1.5250 resistance. The next major hurdle for the bulls might be near $1.550. Another Drop? If XRP fails to clear the $1.4250 resistance zone, it could start a fresh decline. Initial support on the downside is near the $1.40 level. The next major support is near the $1.3850 level. If there is a downside break and a close below the $1.3850 level, the price might continue to decline toward $1.3780. The next major support sits near the $1.3620 zone, below which the price could continue lower toward $1.350. Any more losses might call for a test of $1.3320. Technical Indicators Hourly MACD – The MACD for XRP/USD is now losing pace in the bearish zone. Hourly RSI (Relative Strength Index) – The RSI for XRP/USD is now above the 50 level. Major Support Levels – $1.4000 and $1.3850. Major Resistance Levels – $1.4250 and $1.4400.

XRP price started a downside correction from the $1.4650 zone. The price is now consolidating and might aim for more gains if it stays above the $1.40 zone.
- XRP price started a fresh increase above the $1.420 zone.
- The price is now trading above $1.40 and the 100-hourly Simple Moving Average.
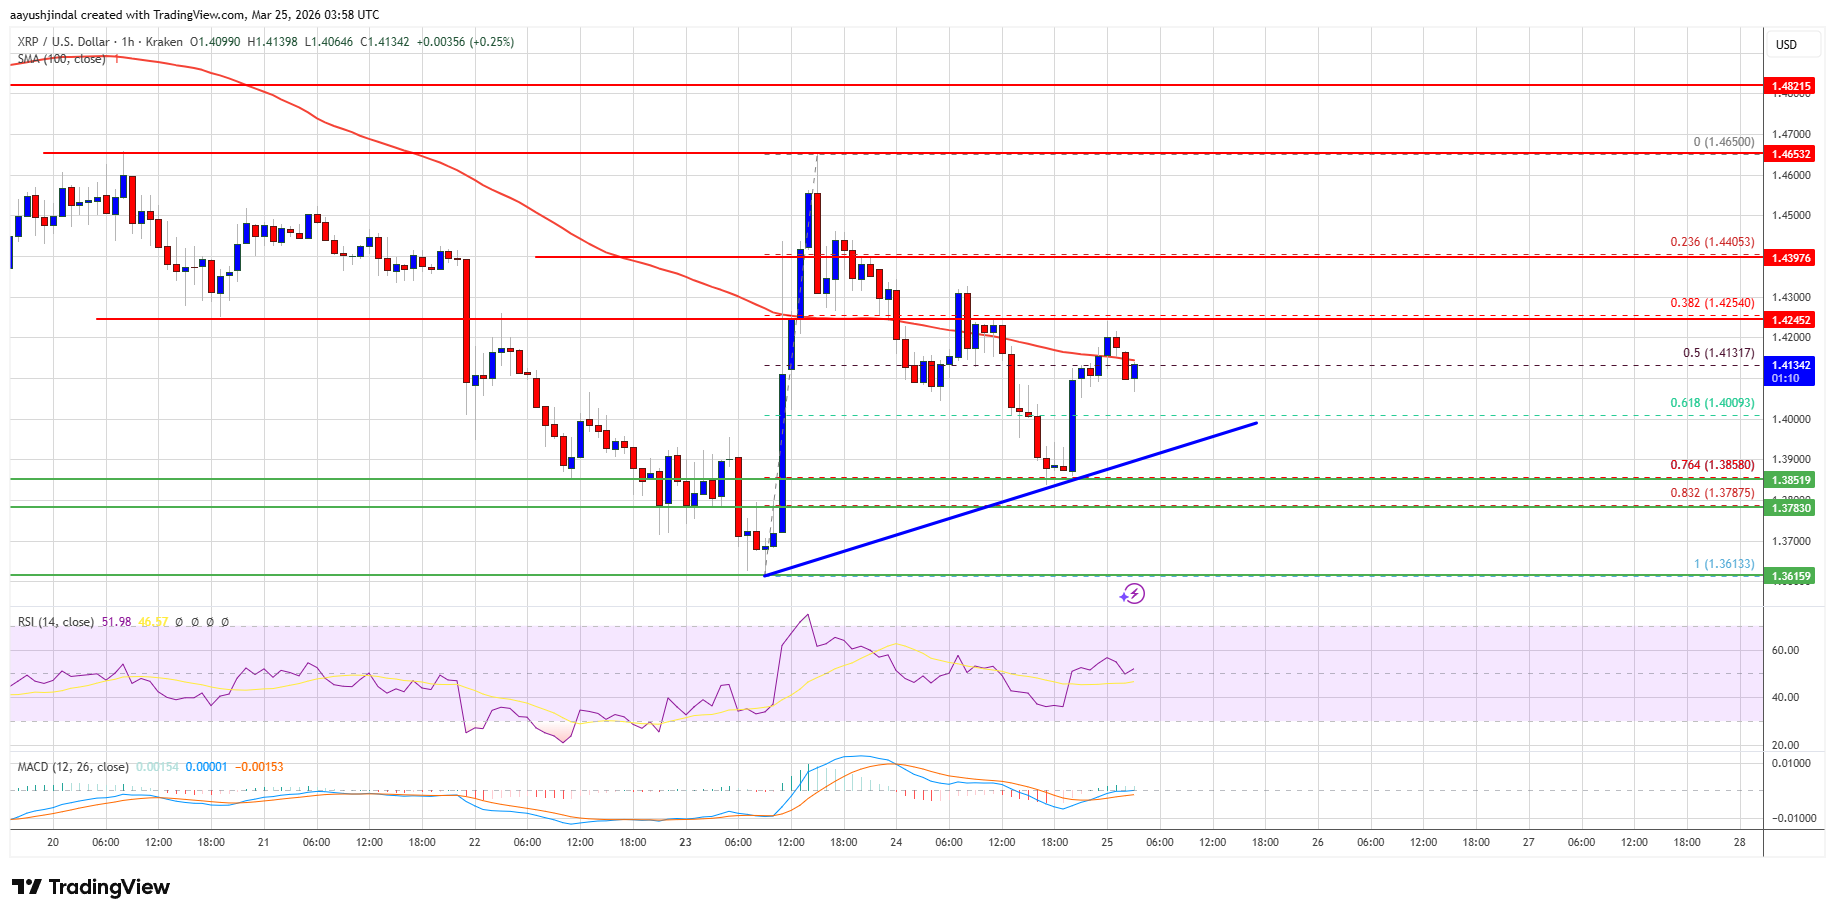
- There is a bullish trend line forming with support at $1.40 on the hourly chart of the XRP/USD pair (data source from Kraken).
- The pair could continue to move up if it settles above $1.4250.
XRP Price Holds Support
XRP price started a decent upward move above $1.4120 and $1.4250, like Bitcoin and Ethereum. The price gained pace for a clear move above the $1.450 resistance.
A high was formed at $1.4650 and the price started a downside correction. There was a move below $1.450 and $1.440. The price dipped below the 61.8% Fib retracement level of the upward move from the $1.3612 swing low to the $1.4650 high.
However, the bulls were active above $1.3850 and the 76.4% Fib retracement level of the upward move from the $1.3612 swing low to the $1.4650 high. The price is now trading above $1.40 and the 100-hourly Simple Moving Average.
If there is a fresh upward move, the price might face resistance near the $1.4250 level. The first major resistance is near the $1.440 level, above which the price could rise and test $1.4650.
A clear move above the $1.4650 resistance might send the price toward the $1.50 resistance. Any more gains might send the price toward the $1.5250 resistance. The next major hurdle for the bulls might be near $1.550.
Another Drop?
If XRP fails to clear the $1.4250 resistance zone, it could start a fresh decline. Initial support on the downside is near the $1.40 level. The next major support is near the $1.3850 level.
If there is a downside break and a close below the $1.3850 level, the price might continue to decline toward $1.3780. The next major support sits near the $1.3620 zone, below which the price could continue lower toward $1.350. Any more losses might call for a test of $1.3320.
Technical Indicators
Hourly MACD – The MACD for XRP/USD is now losing pace in the bearish zone.
Hourly RSI (Relative Strength Index) – The RSI for XRP/USD is now above the 50 level.
Major Support Levels – $1.4000 and $1.3850.
Major Resistance Levels – $1.4250 and $1.4400.
What's Your Reaction?


