


Adani Green Energy Forms Bullish Rectangular Channel Breakout; Check the Chart and Details
Synopsis: Adani Green Energy Ltd has formed a rectangular channel on the 1-hour chart, and an upside breakout indicates a bullish bias. Adani Green Energy Ltd, following a phase of sideways consolidation in recent sessions, has developed a rectangular channel pattern on its 1-hour chart. A rectangular channel shows consolidation within parallel support and resistance […] The post Adani Green Energy Forms Bullish Rectangular Channel Breakout; Check the Chart and Details appeared first on Trade Brains.

Synopsis: Adani Green Energy Ltd has formed a rectangular channel on the 1-hour chart, and an upside breakout indicates a bullish bias.
Adani Green Energy Ltd, following a phase of sideways consolidation in recent sessions, has developed a rectangular channel pattern on its 1-hour chart. A rectangular channel shows consolidation within parallel support and resistance levels. A decisive breakout above resistance signals bullish continuation, indicating buyers are in control and momentum may strengthen.
On Monday, the stock reached a higher high and broke above the key resistance level of Rs 887. The move, backed by a sharp rise in volumes, signals the emergence of near-term bullish momentum.
For a rectangular channel, the price target is estimated by adding the height of the prior range to the breakout level or by identifying the next resistance zones. Traders use this projection to set profit targets and often book partial or full gains as prices near these levels.
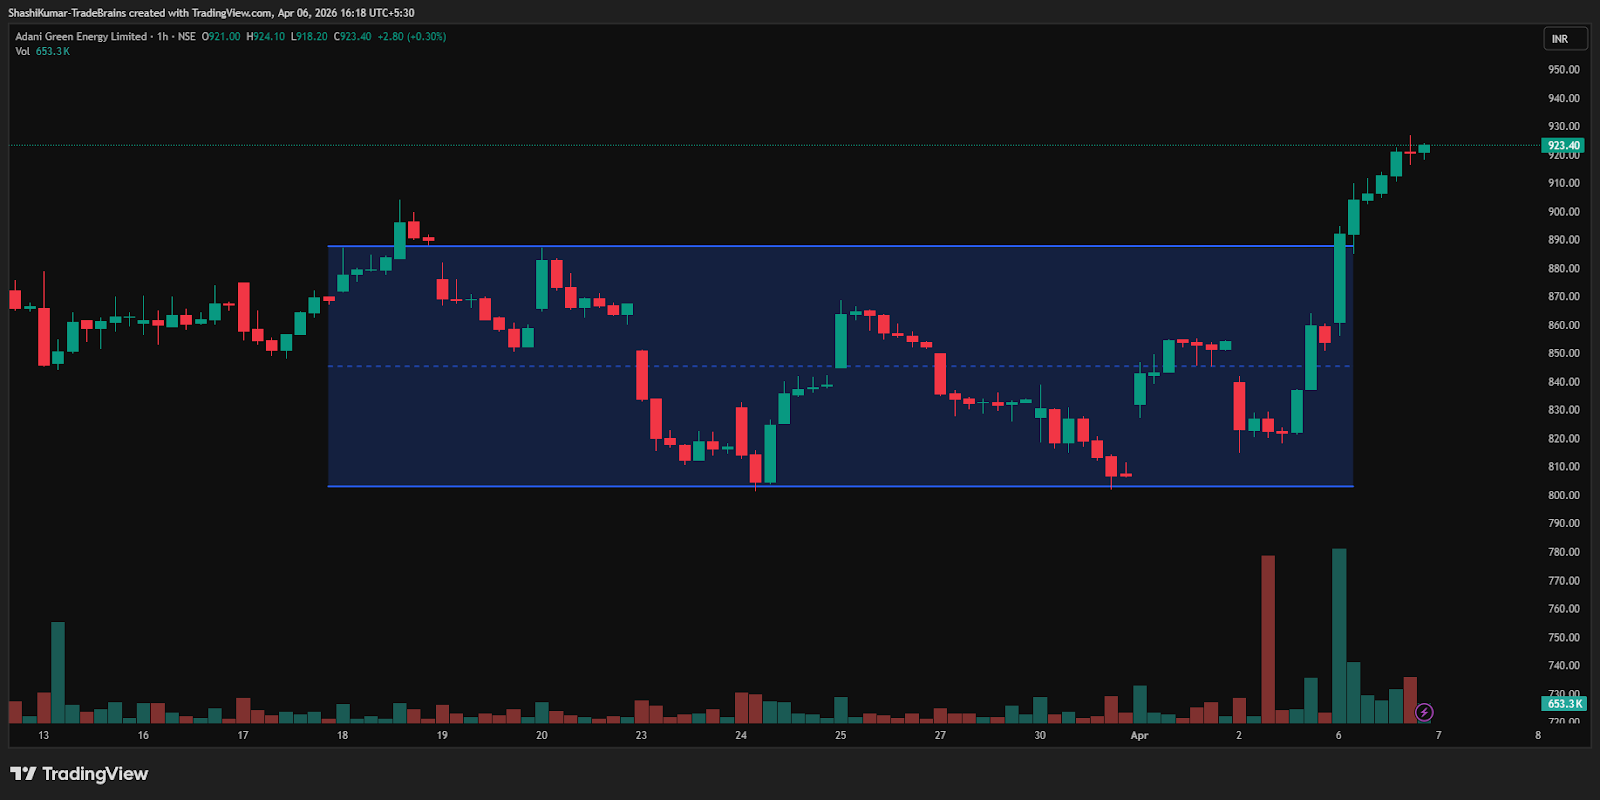
Adani Green Energy Ltd Chart: (1-hour Timeframe)
Indicator Confirmation
- RSI: The daily RSI indicates bullish momentum, as it rose from 46.52 in the previous trading session to 57.18 on Monday.
- MACD: On the daily time frame, the blue MACD line crossed above the orange signal line, with the histogram turning green, indicating bullish momentum.
- Moving Averages: On the daily time frame, the 5-day moving average has crossed above the 9-day moving average, further confirming a bullish trend.
- Price Volume Trend: The Price Volume Indicator confirmed the uptrend, supported by a sharp increase in buying volumes.
- On-Balance Volume: The rising OBV and rising price confirm that the trend is a strong, sustainable upward trend driven by high buying pressure.
Implications
A breakout from the rectangular channel signals possible upside. Sustained closes above Rs 887 with rising buying interest would confirm strength and reduce the risk of a false breakout. This level, now acting as support, is key to maintaining near-term bullish momentum.
About the stock
Adani Green Energy Ltd (AGEL) is India’s largest renewable energy firm, developing and operating utility-scale solar, wind, hybrid, and storage projects. It has over 19.3 GW capacity across 12 states and aims for 50 GW by 2030. Focused on lowering energy costs through technology, AGEL is also building a 30 GW renewable plant in Khavda, Gujarat, one of the world’s largest. Adani Green Energy Ltd has risen 7.64% in the past month but remains down 12.78% over six months while delivering a 5.81% gain over the past year. For more such technical stock ideas, Click here to view our research page.
Disclaimer: The views and investment tips expressed by investment experts/broking houses/rating agencies on tradebrains.in are their own, and not that of the website or its management. Investing in equities poses a risk of financial losses. Investors must therefore exercise due caution while investing or trading in stocks. Trade Brains Technologies Private Limited or the author are not liable for any losses caused as a result of the decision based on this article. Please consult your investment advisor before investing.
The post Adani Green Energy Forms Bullish Rectangular Channel Breakout; Check the Chart and Details appeared first on Trade Brains.
What's Your Reaction?