










































Ambuja Cement Forms An Ascending Triangle Pattern Signaling A Bullish Reversal
Synopsis: Ambuja Cements Ltd has formed an ascending triangle on the daily chart. A flat resistance line and higher lows characterize an ascending triangle, a bullish reversal pattern. Backed by strong buying momentum and rising volumes, the chart reveals a clear bullish breakout above the key resistance zone near Rs 436. Clearing a key resistance level […] The post Ambuja Cement Forms An Ascending Triangle Pattern Signaling A Bullish Reversal appeared first on Trade Brains.



Synopsis: Ambuja Cements Ltd has formed an ascending triangle on the daily chart.
A flat resistance line and higher lows characterize an ascending triangle, a bullish reversal pattern. Backed by strong buying momentum and rising volumes, the chart reveals a clear bullish breakout above the key resistance zone near Rs 436.
Clearing a key resistance level of Rs 436 on July 3rd, Ambuja Cements Ltd has successfully sustained its position to transform that old barrier into a strong support zone. The stock wrapped up the daily chart at Rs 443.40, confirming that bullish momentum is alive and buying interest is only growing stronger.
In an ascending triangle pattern, traders generally look toward the next resistance level or project an upward move equal to the triangle’s height from the breakout point. This bullish breakout is typically validated by strong buying volume and positive momentum.
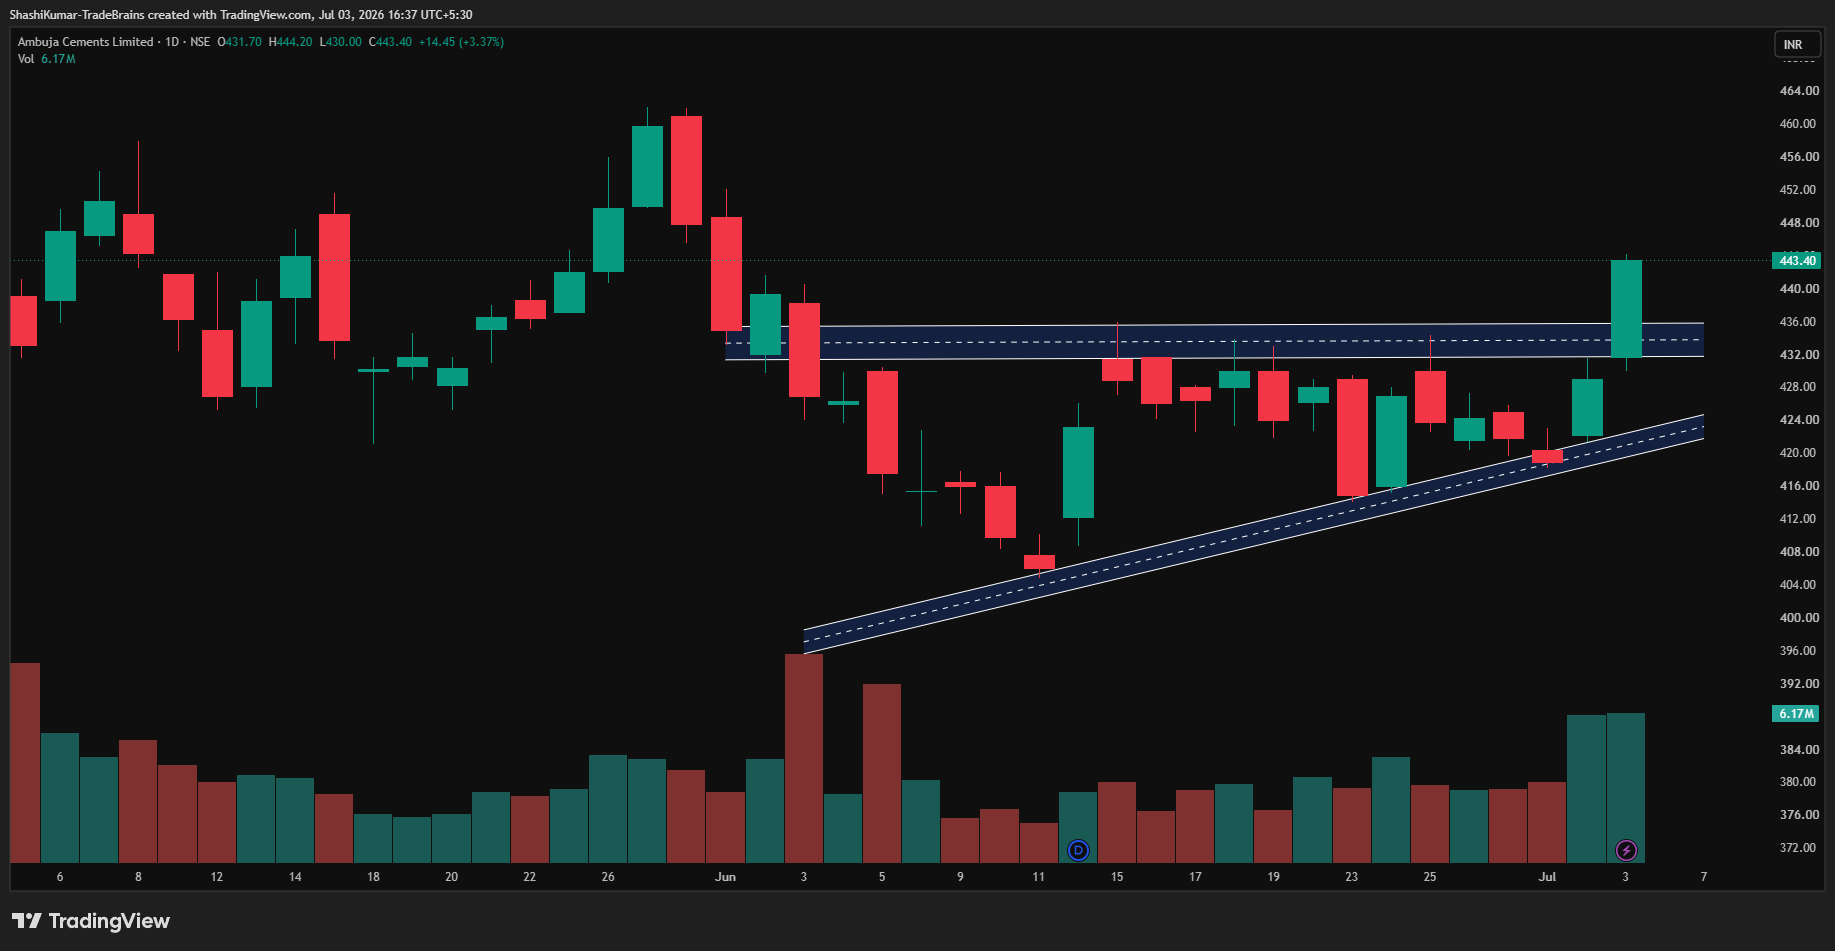
Ambuja Cements Ltd Chart: Daily Timeframe
Indicator Confirmation
- RSI: The daily RSI indicates buying pressure, as it rose from 51.27 in the previous day’s trading session to 58.95 on Friday.
- Price Volume Trend: The Price Volume Indicator confirms the uptrend, accompanied by an increase in buying volume in the daily time frame.
- MACD: On the daily time frame, the blue MACD line was above the orange signal line, with the histogram turning green, indicating bullish momentum.
- Moving Averages: On the daily time frame, the 5-day EMA was crossed above the 9-day EMA, further confirming a bullish trend.
Implications
The ascending triangle pattern in a downtrend indicates potential bullish reversal. So long as the stock holds above the newly established Rs 436 support level on strong volume, the near-term bullish outlook remains firmly intact.
About the stock
Part of the Adani portfolio, Ambuja Cements Limited is the ninth largest building materials solutions company globally. With a cement capacity of 109 MTPA across 24 integrated manufacturing plants and 22 grinding units.
Ambuja Cements Ltd. posted a 3.92% gain this month, marking a recent reversal for the stock. Despite this upward turn, the company’s shares remain down 22.33% over the last six months and have experienced a 24.64% decline in year-over-year returns. For more such technical stock ideas, clickhereto view our research page.
Disclaimer: The views and investment tips expressed by investment experts/broking houses/rating agencies on tradebrains.in are their own, and not that of the website or its management. Investing in equities poses a risk of financial losses. Investors must therefore exercise due caution while investing or trading in stocks. Trade Brains Technologies Private Limited or the author are not liable for any losses caused as a result of the decision based on this article. Please consult your investment advisor before investing.
The post Ambuja Cement Forms An Ascending Triangle Pattern Signaling A Bullish Reversal appeared first on Trade Brains.
What's Your Reaction?