


Asian Paints Ltd Forms An Inverse Head & Shoulders Pattern Signaling A Potential Bullish Breakout
Synopsis: Asian Paints Ltd has developed an inverse head-and-shoulders pattern on its 4-hour chart, indicating a potential near-term bullish reversal. This pattern indicates weakening selling pressure and steadily increasing buying momentum, signalling a potential bullish move ahead. An inverted head-and-shoulders pattern consists of three troughs, with the middle one forming the lowest point (head) and […] The post Asian Paints Ltd Forms An Inverse Head & Shoulders Pattern Signaling A Potential Bullish Breakout appeared first on Trade Brains.


Synopsis: Asian Paints Ltd has developed an inverse head-and-shoulders pattern on its 4-hour chart, indicating a potential near-term bullish reversal.
This pattern indicates weakening selling pressure and steadily increasing buying momentum, signalling a potential bullish move ahead. An inverted head-and-shoulders pattern consists of three troughs, with the middle one forming the lowest point (head) and the two outer troughs forming higher lows (shoulders).
On Wednesday, Asian Paints Ltd broke the resistance neckline in the 4-hour chart and ended the session at Rs 2,615. And the previous resistance level at Rs 2,608 now acts as a support zone. With any push in buying volumes, the price may move further up; below this level weakens the bullish outlook.
Targets are generally set near resistance levels or by projecting the height from the head to the neckline upward. Traders often trail profits while monitoring volume and momentum for confirmation.
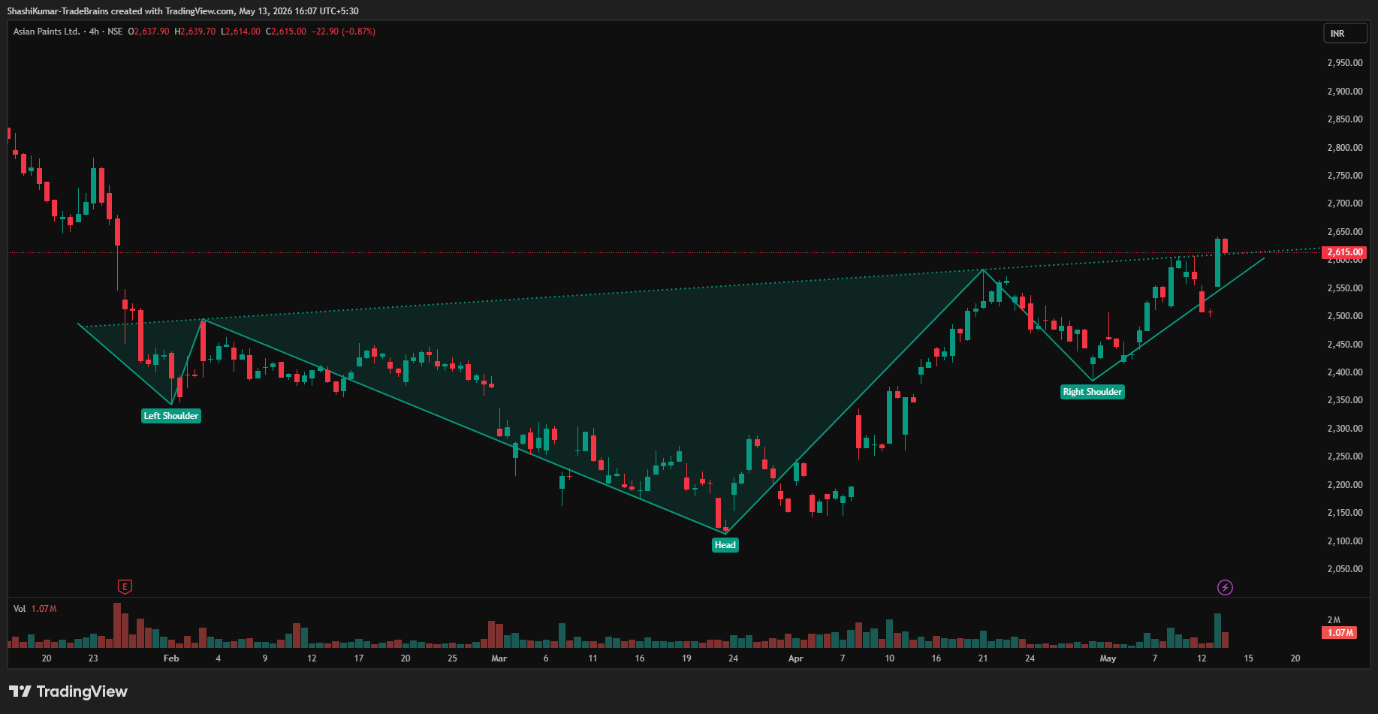
Asian Paints Ltd Chart: 4-hour Timeframe
Indicator Confirmation
- RSI: The daily RSI indicates bullish momentum, as it rose from 56.34 in the previous trading session to 64.81 on Wednesday.
- MACD: On the daily time frame, the blue MACD line was above the orange signal line, with the histogram turning green, indicating bullish momentum.
- Moving Averages: On the daily time frame, the 5-day EMA was above the 9-day EMA, further confirming a bullish trend.
- Price Volume Trend: The Price Volume Indicator confirms the uptrend, accompanied by a sharp increase in buying volume in the daily time frame.
Implications
An inverted head-and-shoulders pattern signals a possible upward breakout. Sustaining it above the Rs 2,608 support level, along with strong trading volumes, would strengthen the bullish outlook in the near term.
About the stock
Asian Paints is India’s leading paint company, founded in 1942 and headquartered in Mumbai. The company is well known for its decorative paints, waterproofing solutions, home decor products, and premium painting services. With a strong presence in India and several international markets, Asian Paints is recognised for its innovation, trusted brand value, and wide distribution network that helps it remain a market leader in the paint industry.
Asian Paints Ltd has gained 11.16% in the past month. Despite short-term gains, the stock has declined by 9.18% in the last six months, and on a year-over-year basis, it has delivered a 12.49% return. For more such technical stock ideas, clickhereto view our research page.
Disclaimer: The views and investment tips expressed by investment experts/broking houses/rating agencies on tradebrains.in are their own, and not that of the website or its management. Investing in equities poses a risk of financial losses. Investors must therefore exercise due caution while investing or trading in stocks. Trade Brains Technologies Private Limited or the author are not liable for any losses caused as a result of the decision based on this article. Please consult your investment advisor before investing.
The post Asian Paints Ltd Forms An Inverse Head & Shoulders Pattern Signaling A Potential Bullish Breakout appeared first on Trade Brains.
What's Your Reaction?