


Bullish Signal: IT Stock Forms Double Bottom Pattern, Check The Charts
Synopsis: Inventurus Knowledge Solutions Ltd has formed a double-bottom pattern on the 30-minute chart, signalling a potential near-term bullish reversal. The formation of a double bottom after a prolonged downtrend indicates strong buying interest at lower levels. A decisive breakout above the neckline suggests a potential shift toward a bullish trend. On the chart, the […] The post Bullish Signal: IT Stock Forms Double Bottom Pattern, Check The Charts appeared first on Trade Brains.


Synopsis: Inventurus Knowledge Solutions Ltd has formed a double-bottom pattern on the 30-minute chart, signalling a potential near-term bullish reversal.
The formation of a double bottom after a prolonged downtrend indicates strong buying interest at lower levels. A decisive breakout above the neckline suggests a potential shift toward a bullish trend.
On the chart, the stock has broken above the double-bottom neckline and continues to hold above it. On Tuesday, Inventurus Knowledge Solutions Ltd broke above the double-bottom neckline on the 30-minute chart, confirming the pattern backed by steady buying volumes. Sustaining above the Rs 1,340 support level, indicates near-term bullish momentum and scope for further gains.
In a double-bottom pattern, upside targets are typically placed at resistance levels above the neckline, where traders may book profits while monitoring momentum for continuation or signs of exhaustion.
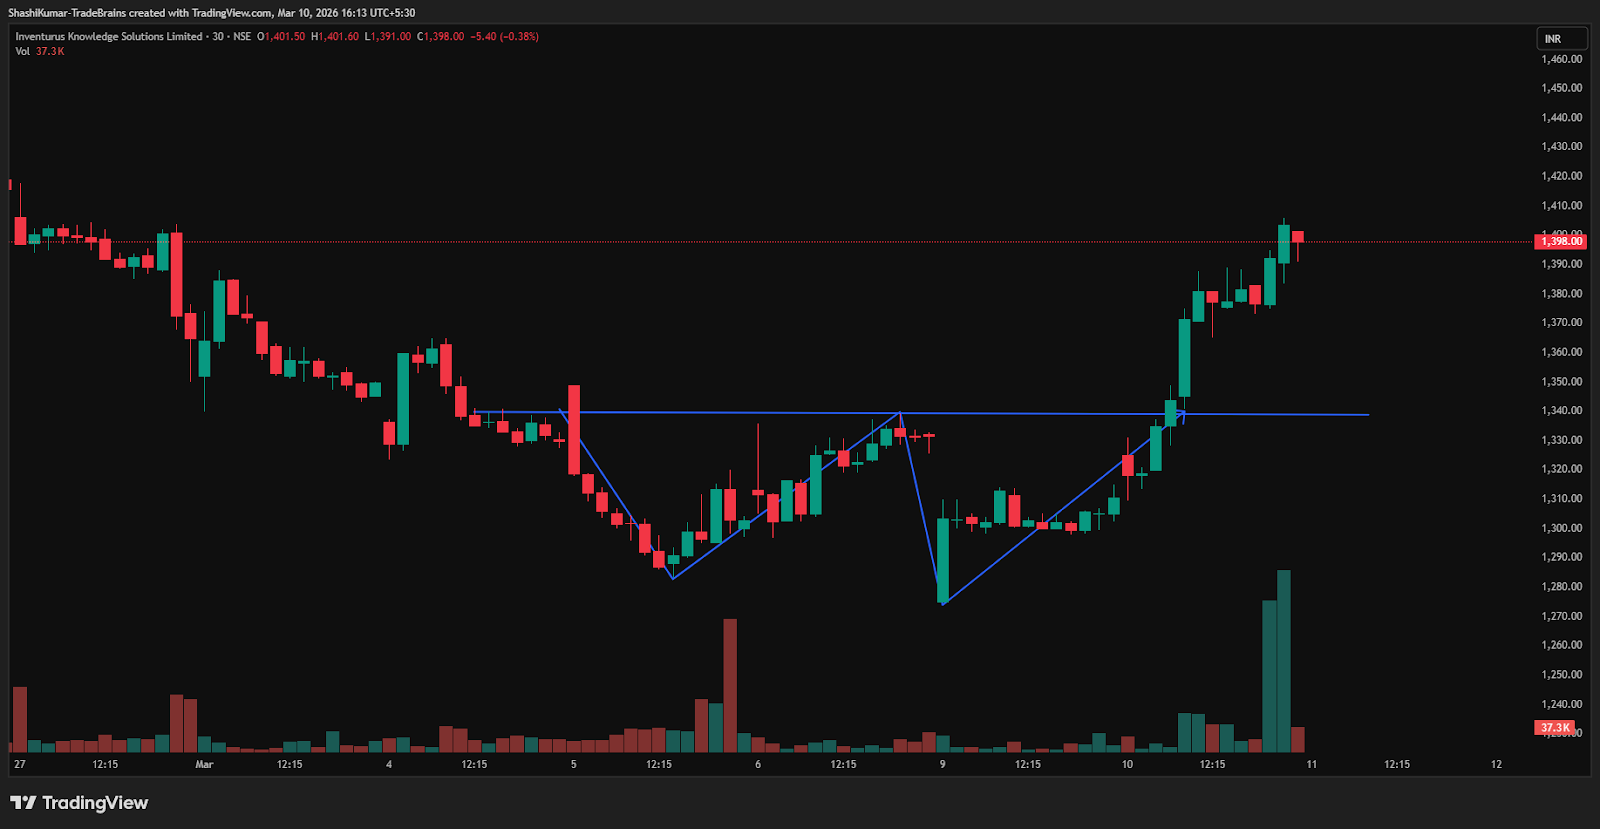
Inventurus Knowledge Solutions Ltd Chart: 30-min Timeframe
Indicator Confirmation
- RSI: The daily RSI indicates bullish reversal, as it rose from 25 in the previous trading session to 39 on Tuesday.
- Price Volume Trend: The Price Volume Indicator confirms the uptrend, accompanied by a sharp increase in buying volume in the daily time frame.
- On-Balance Volume: The Rising OBV and rising in price confirmed the trend is strong, sustainable upward trend driven by high buying pressure.
Implications
A double-bottom pattern signals potential upside. A strong close above Rs 1,340 with good volumes would confirm the reversal, and sustaining above this level as support would strengthen the near-term bullish trend.
About the stock
Founded in 2006, Inventurus Knowledge Solutions Ltd (IKS) helps healthcare organizations reduce administrative, clinical, and operational burdens so clinicians can focus on patient care. It’s Care Enablement platform combines AI, agentic workflows, and human expertise to improve efficiency, outcomes, and financial sustainability across the care journey. IKS Health partners with leading U.S. health systems and physician groups and has been recognized by Black Book, KLAS, and Google Cloud for its AI-driven innovation.
Over the past month, Inventurus Knowledge Solutions Ltd’s stock has declined by 20.47%. Over the last six months, it has fallen by 9%, and on a year-over-year basis, the stock is down 18.57%.
For more such technical stock ideas, click here to view our research page.
Disclaimer: The views and investment tips expressed by investment experts/broking houses/rating agencies on tradebrains.in are their own, and not that of the website or its management. Investing in equities poses a risk of financial losses. Investors must therefore exercise due caution while investing or trading in stocks. Trade Brains Technologies Private Limited or the author are not liable for any losses caused as a result of the decision based on this article. Please consult your investment advisor before investing.
The post Bullish Signal: IT Stock Forms Double Bottom Pattern, Check The Charts appeared first on Trade Brains.
What's Your Reaction?