


Central Depository Service Ltd Forms a Head & Shoulders Pattern Signaling Potential Bearish Momentum
Synopsis: Central Depository Service (India) Ltd has formed a head-and-shoulders pattern on the 2-hour chart, signalling a potential near-term bearish momentum. This pattern suggests that selling pressure is strengthening while buying interest is gradually decreasing. A head-and-shoulders pattern consists of three troughs, with the middle one forming the highest point (head) and the two outer […] The post Central Depository Service Ltd Forms a Head & Shoulders Pattern Signaling Potential Bearish Momentum appeared first on Trade Brains.


Synopsis: Central Depository Service (India) Ltd has formed a head-and-shoulders pattern on the 2-hour chart, signalling a potential near-term bearish momentum.
This pattern suggests that selling pressure is strengthening while buying interest is gradually decreasing. A head-and-shoulders pattern consists of three troughs, with the middle one forming the highest point (head) and the two outer troughs forming higher highs (shoulders).
On Tuesday, Central Depository Service (India) Ltd broke below the neckline (support) in the 2-hour chart. Sustaining below Rs 1,226 could trigger further downside pressure, while a move above this level may weaken the ongoing bearish sentiment.
Targets are generally set near support levels or by projecting the distance from the head to the neckline downward from the breakdown point. Traders often trail profits while closely monitoring selling volume and bearish momentum for confirmation.
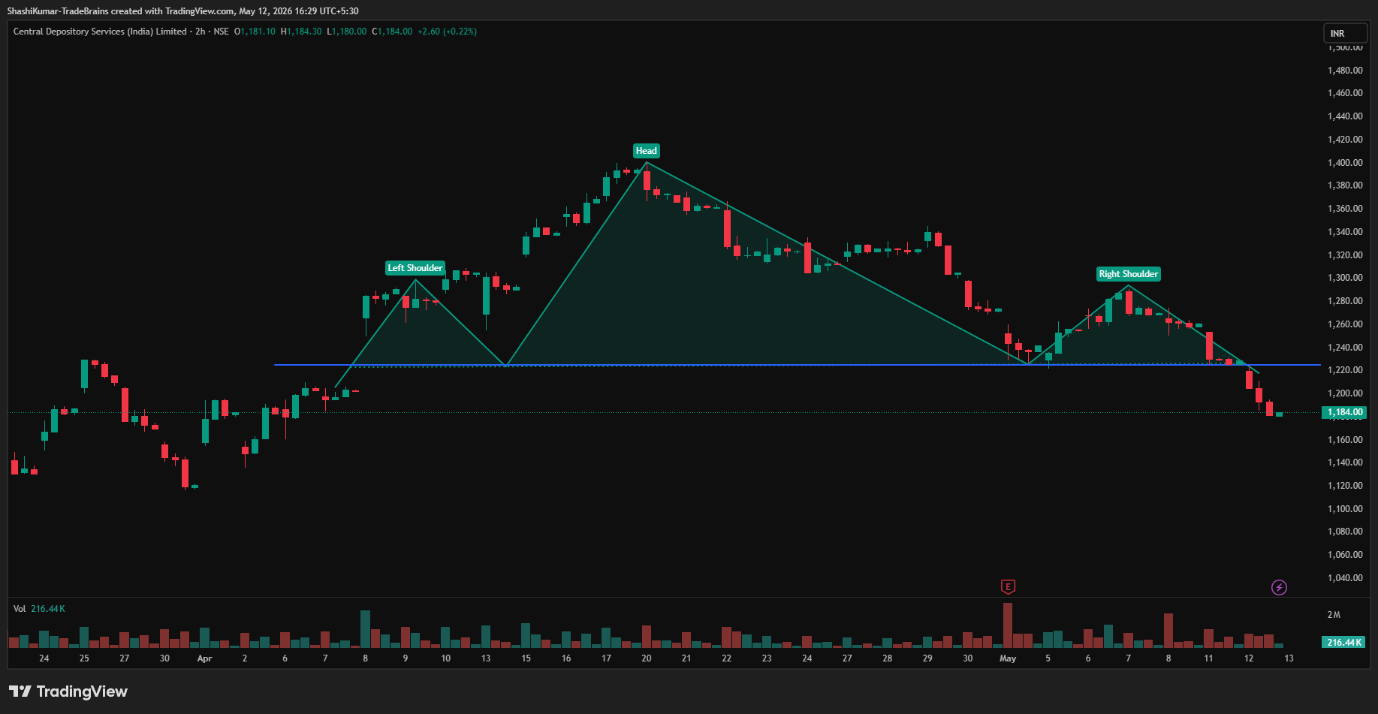
Central Depository Service (India) Limited Chart: 2-hrs Timeframe
Indicator Confirmation
- RSI: The daily RSI indicates bearish momentum, as it declined from 41.35 in the previous trading session to 35.96 on Tuesday.
- MACD: On the daily time frame, the blue MACD line was below the orange signal line, with the histogram turning red, indicating bearish momentum.
- Moving Averages: On the daily time frame, the 5-day EMA was below the 9-day EMA, further confirming a bearish trend.
- Price Volume Trend: The Price Volume Indicator confirms the downtrend, accompanied by a sharp decrease in buying volume in the daily time frame.
Implications
A head-and-shoulders pattern signals a possible downward breakout. Sustaining below the Rs 1,226 resistance level, along with strong trading volumes, would strengthen the bearish outlook in the near term.
Central Depository Services (India) Limited is one of India’s leading market infrastructure institutions, enabling secure and paperless holding of shares, bonds, and other securities in electronic form. Established in 1999 and headquartered in Mumbai, CDSL plays a vital role in India’s capital markets through services like demat accounts, e-voting, online transaction access, and digital document storage. With millions of active investors using its platform, CDSL has become a trusted backbone of India’s growing investment ecosystem.
Central Depository Service (India) Ltd has decreased by 8.26% in the past month. However, over the last six months, the stock has declined by 28.47%, and on a year-over-year basis, it is down 7.43%. For more such technical stock ideas, click here to view our research page.
Disclaimer: The views and investment tips expressed by investment experts/broking houses/rating agencies on tradebrains.in are their own, and not that of the website or its management. Investing in equities poses a risk of financial losses. Investors must therefore exercise due caution while investing or trading in stocks. Trade Brains Technologies Private Limited or the author are not liable for any losses caused as a result of the decision based on this article. Please consult your investment advisor before investing.
The post Central Depository Service Ltd Forms a Head & Shoulders Pattern Signaling Potential Bearish Momentum appeared first on Trade Brains.
What's Your Reaction?