


Titan Company Ltd Forms a Descending Triangle Patterns Hinting at a Near-Term Bearish Movement
Synopsis: Titan Company Ltd has formed a descending triangle on the 15-min chart, signalling a possible short-term bearish movement. A descending triangle is a bearish continuation pattern marked by lower lows and a flat/inclined support line; breaking below the support line strengthens the bearish outlook. The chart shows a confirmed bearish breakdown from a descending […] The post Titan Company Ltd Forms a Descending Triangle Patterns Hinting at a Near-Term Bearish Movement appeared first on Trade Brains.


Synopsis: Titan Company Ltd has formed a descending triangle on the 15-min chart, signalling a possible short-term bearish movement.
A descending triangle is a bearish continuation pattern marked by lower lows and a flat/inclined support line; breaking below the support line strengthens the bearish outlook.
The chart shows a confirmed bearish breakdown from a descending triangle pattern below the key support level, backed by a surge in selling volume. On Tuesday, Titan Company Ltd broke the support neckline and sustained a level below the Rs 4,095 level, which is now acting as a resistance zone in the 15-min. chart, reinforcing its bearish momentum.
In a descending triangle pattern, traders typically target the nearest support breakdown level or project a price move equal to the triangle’s height from the breakdown point, while using strong selling volume and bearish momentum to confirm the trade.
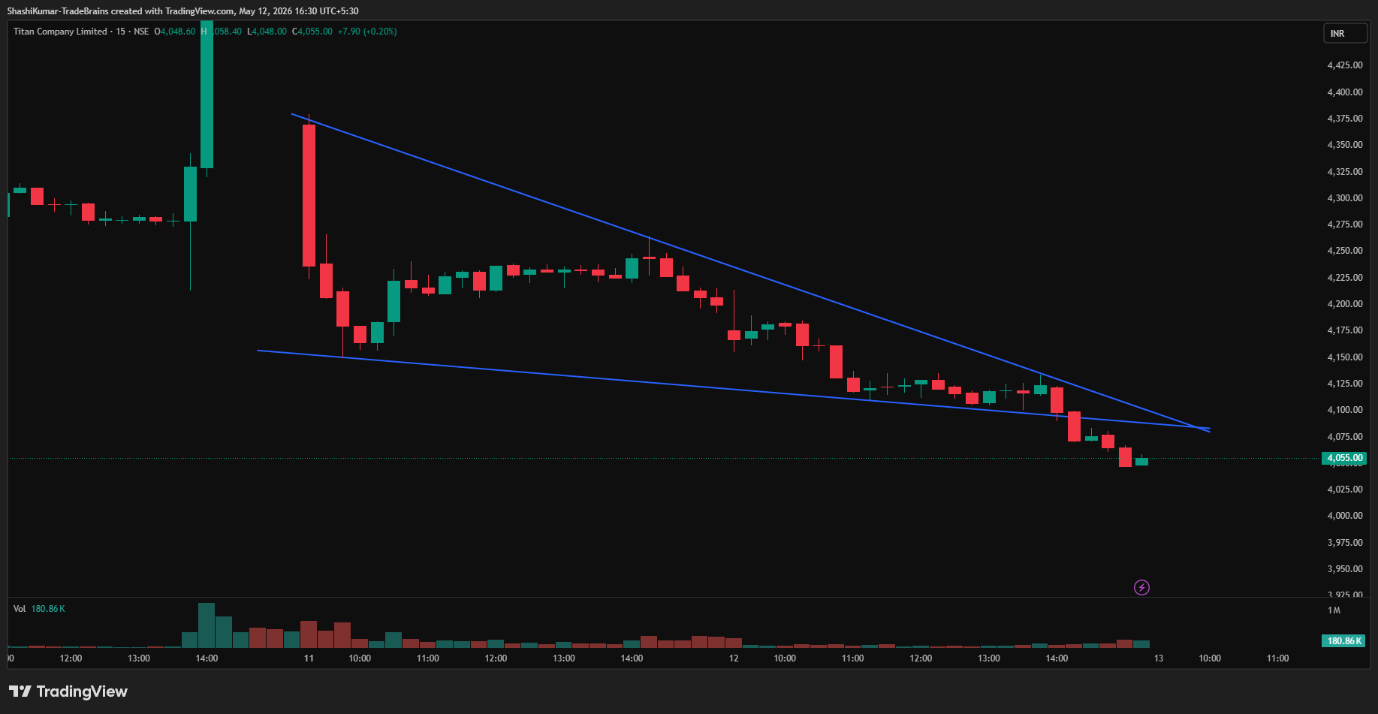
Titan Company Ltd Chart: 15-min Timeframe
Indicator Confirmation
- RSI: The daily RSI indicates selling pressure, as it declined from 42.61 in the previous trading session to 36.90 on Tuesday.
- MACD: On the daily time frame, the blue MACD line was below the orange signal line, with the histogram turning red, indicating bearish momentum.
- Price Volume Trend: The Price Volume Indicator confirms the downtrend, accompanied by an increase in selling volume in the daily timeframe.
- Moving Averages: On the daily time frame, the 5-day moving average was below the 9-day moving average, further confirming a bearish trend.
Implications
The descending triangle pattern indicates continued downside potential. Maintaining levels below the Rs 4,095 resistance mark, especially with strong trading volumes in selling, would further strengthen the near-term bearish outlook.
About the stock
Titan Company Limited is one of India’s leading lifestyle companies, established in 1984 as a joint venture between the Tata Group and TIDCO. The company is widely known for popular brands like Tanishq, Titan, Fastrack, Titan Eyeplus, and CaratLane, offering jewellery, watches, eyewear, and fashion accessories. With a strong retail presence across India, Titan is recognised for its quality products, premium customer experience, and trusted brand value.
Titan Company Ltd has come under strong selling pressure, falling 8.58% in the past month despite posting gains of 5.38% over the last six months and nearly 13.91% on a yearly basis. For more such technical stock ideas, clickhereto view our research page.
Disclaimer: The views and investment tips expressed by investment experts/broking houses/rating agencies on tradebrains.in are their own, and not that of the website or its management. Investing in equities poses a risk of financial losses. Investors must therefore exercise due caution while investing or trading in stocks. Trade Brains Technologies Private Limited or the author are not liable for any losses caused as a result of the decision based on this article. Please consult your investment advisor before investing.
The post Titan Company Ltd Forms a Descending Triangle Patterns Hinting at a Near-Term Bearish Movement appeared first on Trade Brains.
What's Your Reaction?