


Elecon Engineering Stock Forms An Inverted Head and Shoulders Pattern Hinting At Near Term Bullish Reversal
Synopsis:Elecon Engineering Company Limited has formed an inverted head-and-shoulders pattern on the 4-hour chart, signalling a potential near-term bullish reversal. This pattern suggests that selling pressure is easing while buying interest is gradually strengthening. An inverted head-and-shoulders pattern consists of three troughs, with the middle one forming the lowest point (head) and the two outer […] The post Elecon Engineering Stock Forms An Inverted Head and Shoulders Pattern Hinting At Near Term Bullish Reversal appeared first on Trade Brains.


Synopsis:Elecon Engineering Company Limited has formed an inverted head-and-shoulders pattern on the 4-hour chart, signalling a potential near-term bullish reversal.
This pattern suggests that selling pressure is easing while buying interest is gradually strengthening. An inverted head-and-shoulders pattern consists of three troughs, with the middle one forming the lowest point (head) and the two outer troughs forming higher lows (shoulders). A breakout above the neckline typically signals a bullish reversal.
On Tuesday, Elecon Engineering Company Limited broke above the neckline of this pattern on the 4-hour chart. Sustaining above Rs 447 may lead to further upside, while slipping below this level could weaken the bullish bias.
Targets are generally set near resistance levels or by projecting the height from the head to the neckline upward. Traders often trail profits while monitoring volume and momentum for confirmation.
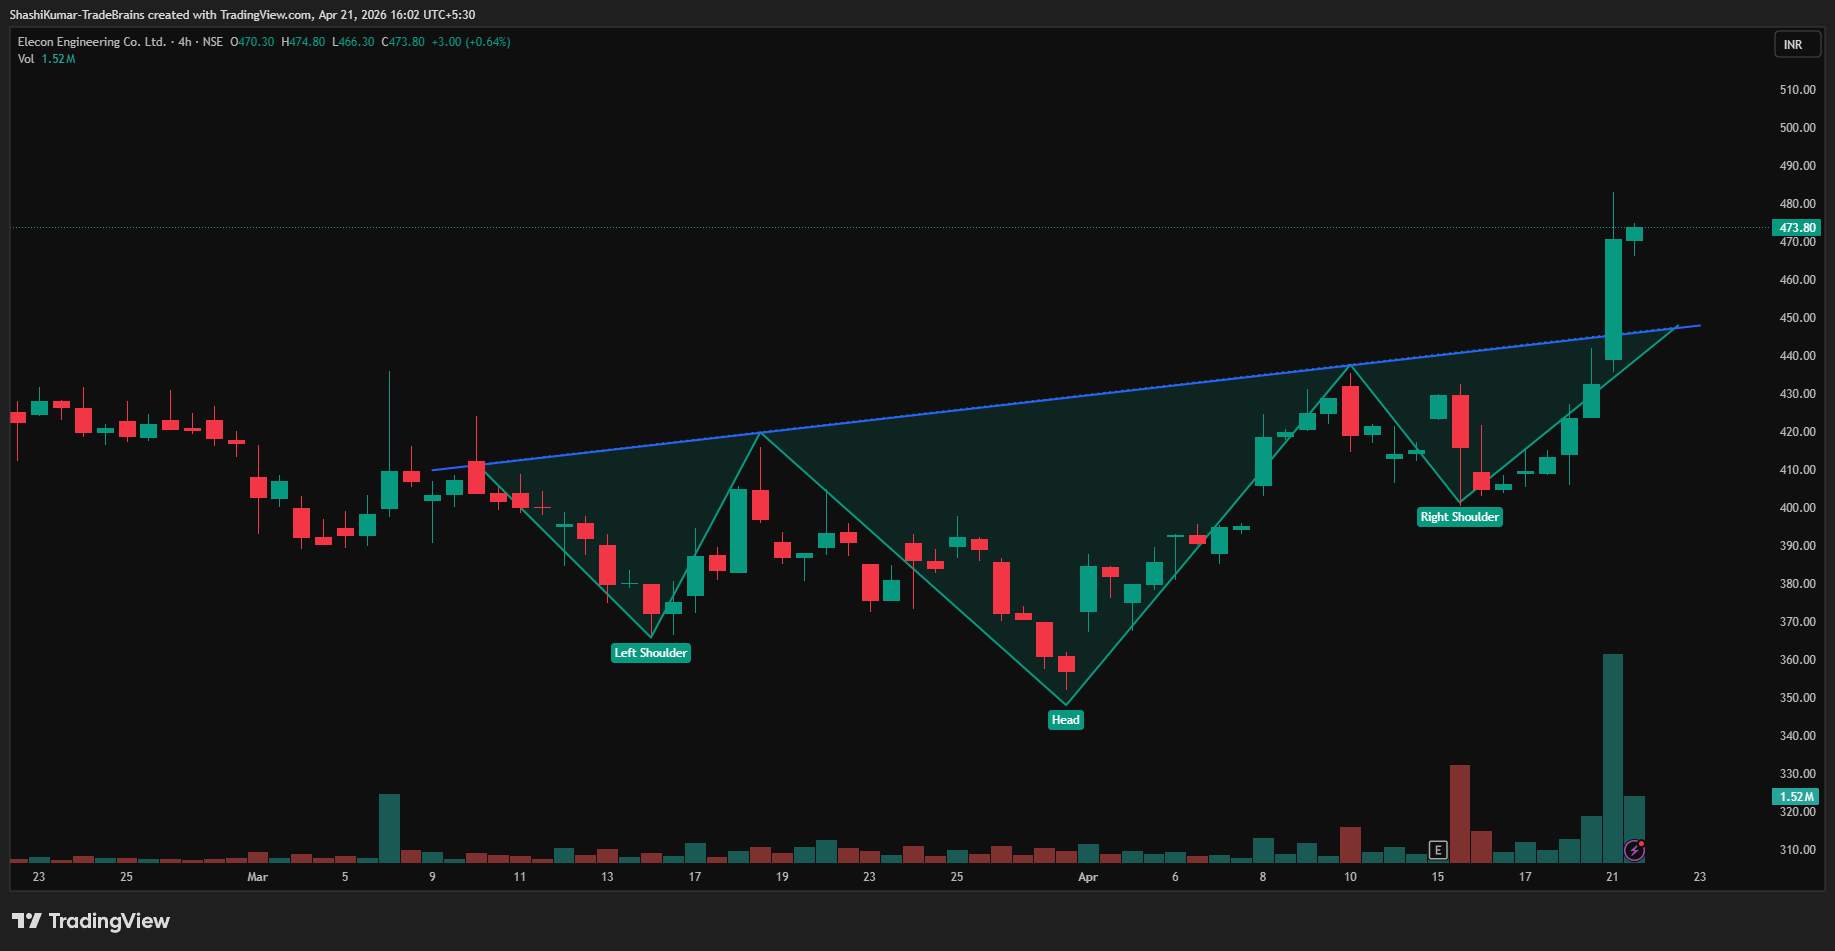
Elecon Engineering Company Ltd Chart: 4-hour Timeframe
Indicator Confirmation
- RSI: The daily RSI indicates bullish momentum, as it rose from 62.32 in the previous trading session to 70.53 on Tuesday.
- MACD: On the daily time frame, the blue MACD line was above the orange signal line, with the histogram turning green, indicating bullish momentum.
- Moving Averages: On the daily time frame, the 5-day moving average was above the 9-day moving average, further confirming a bullish trend.
- Price Volume Trend: The Price Volume Indicator confirms the uptrend, accompanied by a sharp increase in buying volume in the daily time frame.
Implications
An inverted head-and-shoulders pattern signals a possible upward breakout. Sustaining above the Rs 447 support level, along with strong trading volumes, would strengthen the bullish outlook in the near term.
About the stock
Elecon Engineering Company Limited, established in 1951, is one of Asia’s leading industrial gear and material handling equipment manufacturers. With over 70 years of expertise and facilities spanning 335,000 sq. metres, it serves 100+ countries. The company provides end-to-end solutions, from design to commissioning, catering to sectors like cement, steel, mining, power, sugar, and defence.
Elecon Engineering Company Limited has gained 24.76% in the past month. However, over the last six months, the stock has declined by 14.59%, and on a year-over-year basis, it is down 4.71%. For more such technical stock ideas, click here to view our research page.
Disclaimer: The views and investment tips expressed by investment experts/broking houses/rating agencies on tradebrains.in are their own, and not that of the website or its management. Investing in equities poses a risk of financial losses. Investors must therefore exercise due caution while investing or trading in stocks. Trade Brains Technologies Private Limited or the author are not liable for any losses caused as a result of the decision based on this article. Please consult your investment advisor before investing.
The post Elecon Engineering Stock Forms An Inverted Head and Shoulders Pattern Hinting At Near Term Bullish Reversal appeared first on Trade Brains.
What's Your Reaction?