


HUDCO Shares Ready for Upside Move Following Ascending Triangle Pattern Formation; Check the Details
Synopsis: Housing and Urban Development Corp Ltd has formed an ascending triangle pattern on the 1-hour chart, suggesting a potential near-term bullish momentum. An ascending triangle is a bullish continuation pattern where price forms a series of higher lows while facing a horizontal resistance. This creates a triangular shape, reflecting gradually increasing buying pressure as […] The post HUDCO Shares Ready for Upside Move Following Ascending Triangle Pattern Formation; Check the Details appeared first on Trade Brains.


Synopsis: Housing and Urban Development Corp Ltd has formed an ascending triangle pattern on the 1-hour chart, suggesting a potential near-term bullish momentum.
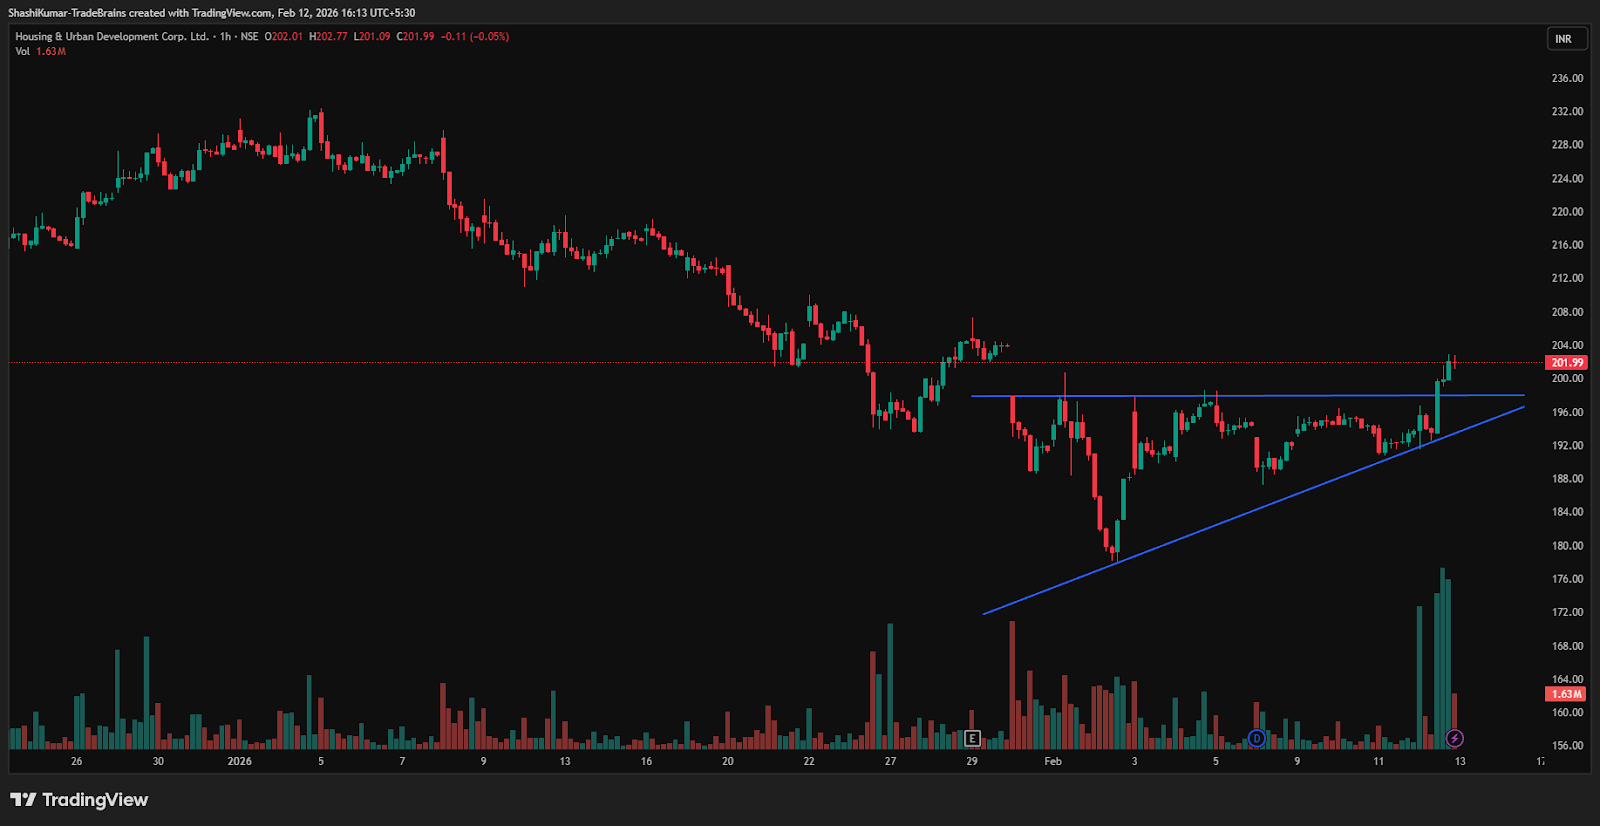
An ascending triangle is a bullish continuation pattern where price forms a series of higher lows while facing a horizontal resistance. This creates a triangular shape, reflecting gradually increasing buying pressure as buyers push prices higher toward the resistance level.
From the above chart, the ascending triangle pattern has completed a bullish breakout, as the price has moved above the horizontal resistance level. This breakout, ideally accompanied by strong volume, signals rising buying pressure and suggests a potential upward move in the near term.
On Thursday, Housing and Urban Development Corp Ltd broke above the neckline of the ascending triangle pattern on the 1-hour chart and continued trading above the Rs 198 level, maintaining the bullish bias.
For an ascending triangle, targets can be set at immediate resistance levels or by projecting the height of the triangle from the breakout point. Traders monitor volume and momentum for confirmation and may trail profits as the price moves higher following the bullish breakout.
Housing And Urban Development Corp Ltd Chart: 1-hour Timeframe
Indicator Confirmation
- RSI: The daily RSI indicates bullish momentum, as it rose from 39.6 in the previous trading session to 49.4 on Thursday, confirming the bullish reversal.
- MACD: On the daily time frame, the blue MACD line crossed above the orange signal line, with the histogram turning green, indicating bullish momentum.
- Moving Averages: On the daily time frame, the 5-day moving average has crossed above the 9-day moving average, further confirming a bullish trend.
- Price Volume Trend: The Price Volume Indicator confirms the uptrend, accompanied by a sharp increase in buying volume in the daily time frame.
Implications
The ascending triangle pattern indicates potential upside. Holding above Rs 198 support, supported by strong volumes, would reinforce near-term bullish momentum.
About the stock
Housing and Urban Development Corporation Limited was incorporated in 1970 and is registered with the Reserve Bank of India (RBI) as an Infrastructure Finance Company (IFC). The company mainly provides financing for infrastructure projects nationwide, with a particular emphasis on housing and urban development.
Over the past month, Housing and Urban Development Corporation Ltd has declined by 7.14%. Over the last six months, the stock has slipped 4.12%, though it remains up 4.85% compared to a year ago. For more such technical stock ideas, click here to view our research page.
Disclaimer: The views and investment tips expressed by investment experts/broking houses/rating agencies on tradebrains.in are their own, and not that of the website or its management. Investing in equities poses a risk of financial losses. Investors must therefore exercise due caution while investing or trading in stocks. Trade Brains Technologies Private Limited or the author are not liable for any losses caused as a result of the decision based on this article. Please consult your investment advisor before investing.
The post HUDCO Shares Ready for Upside Move Following Ascending Triangle Pattern Formation; Check the Details appeared first on Trade Brains.
What's Your Reaction?