


ITC ltd Makes An Inverse Flag & Pole Pattern Hinting At a Strong Bearish Breakout
Synopsis:ITC Limited has developed an inverse flag & pole pattern on its 1-day chart, indicating a potential near-term bearish movement. This pattern suggests that buying momentum is weakening while selling pressure is gradually increasing, indicating a potential continuation of the bearish trend. The inverted flag, also called a bear flag, is a bearish chart pattern […] The post ITC ltd Makes An Inverse Flag & Pole Pattern Hinting At a Strong Bearish Breakout appeared first on Trade Brains.


Synopsis:ITC Limited has developed an inverse flag & pole pattern on its 1-day chart, indicating a potential near-term bearish movement.
This pattern suggests that buying momentum is weakening while selling pressure is gradually increasing, indicating a potential continuation of the bearish trend. The inverted flag, also called a bear flag, is a bearish chart pattern where the price falls sharply, then moves slightly upward for a short period before continuing its downward trend after a breakdown.
On Friday, ITC Limited broke the support line in the 1-day chart and ended the session at Rs 307.45. And the previous support level at Rs 308.40 now acts as a resistance zone. With any increase in selling volumes, the price may move further downward; a move above this level weakens the bearish outlook.
In an inverted flag & pole pattern, traders typically target the nearest support level or project a price move equal to the flagpole’s height from the breakdown point, while using strong selling volume and bearish momentum to confirm the trend continuation.
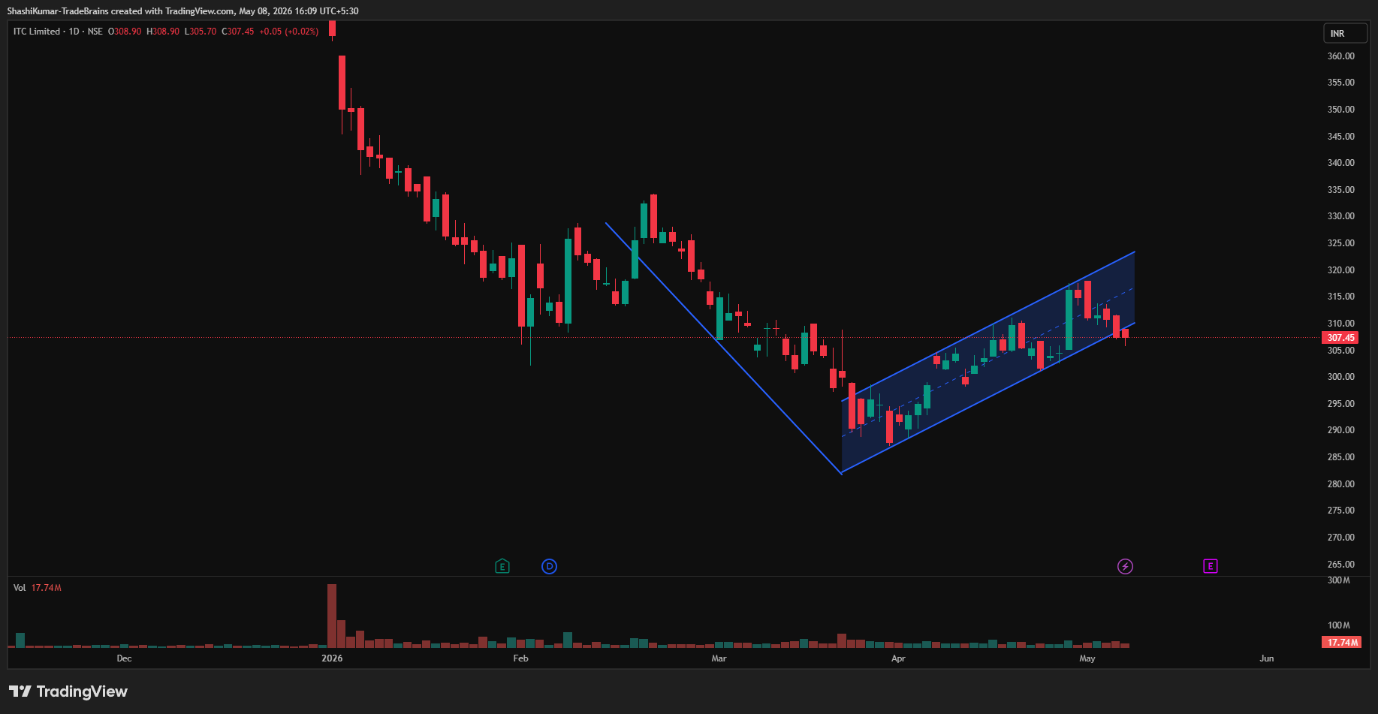
ITC Limited Chart: 1-day Timeframe
Indicator Confirmation
Price Volume Trend: The Price Volume Indicator confirms the downtrend, accompanied by an increase in selling volume in the daily time frame.
Implications
An inverted flag & pole pattern signals a possible downward breakout. Sustaining below the Rs 308.40 resistance level, along with strong trading volumes, would strengthen the bearish outlook in the near term.
ITC Limited is a leading Indian conglomerate established in 1910 and headquartered in Kolkata, with businesses across FMCG, hotels, paperboards & packaging, agribusiness, and information technology. The company is known for its strong presence in the cigarette industry and its popular Indian consumer brands in foods, personal care, and stationery.
ITC is also recognised for its sustainability initiatives and focus on rural development and digital transformation. Over the past month, ITC Limited Ltd has raised 1.57%. The stock has declined 24.25% over the past six months and declined 28.66% year-over-year. For more such technical stock ideas, click here to view our research page.
Disclaimer: The views and investment tips expressed by investment experts/broking houses/rating agencies on tradebrains.in are their own, and not that of the website or its management. Investing in equities poses a risk of financial losses. Investors must therefore exercise due caution while investing or trading in stocks. Trade Brains Technologies Private Limited or the author are not liable for any losses caused as a result of the decision based on this article. Please consult your investment advisor before investing.
The post ITC ltd Makes An Inverse Flag & Pole Pattern Hinting At a Strong Bearish Breakout appeared first on Trade Brains.
What's Your Reaction?