


L&T Finance forms Bearish Rounding Pattern; Check the support and resistance
Synopsis: L&T Finance Ltd has formed a rounding top pattern on the 4-hour chart, with a downside breakout indicating a bearish bias. L&T Finance Ltd, after a sustained uptrend followed by sideways consolidation in recent sessions, has formed a rounding top pattern on its 4-hour chart, with the downside breakout signalling a potential continuation of […] The post L&T Finance forms Bearish Rounding Pattern; Check the support and resistance appeared first on Trade Brains.


Synopsis: L&T Finance Ltd has formed a rounding top pattern on the 4-hour chart, with a downside breakout indicating a bearish bias.
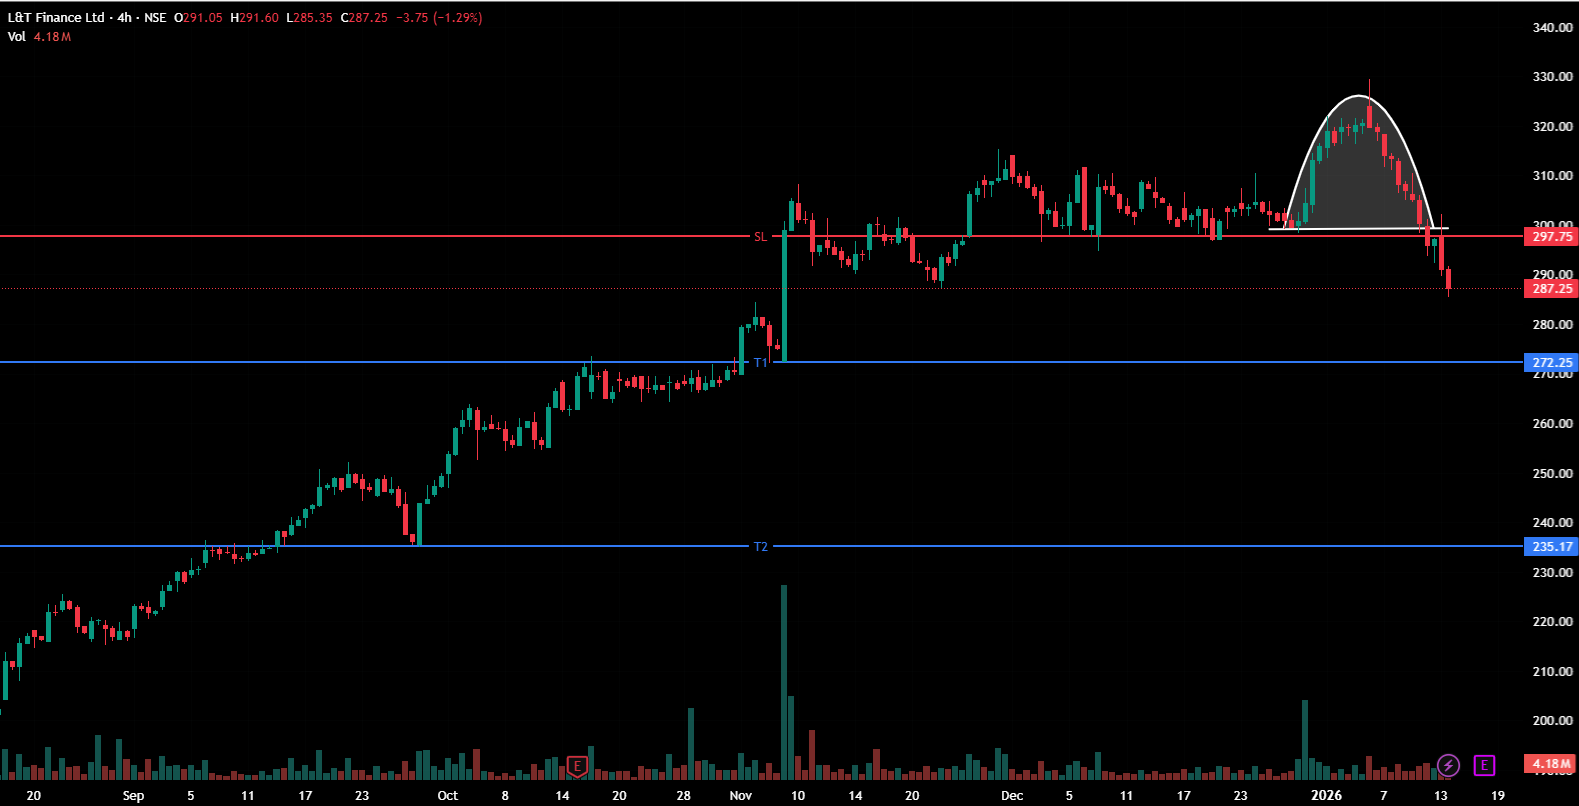
L&T Finance Ltd, after a sustained uptrend followed by sideways consolidation in recent sessions, has formed a rounding top pattern on its 4-hour chart, with the downside breakout signalling a potential continuation of bearish momentum.
The rounding top pattern signals a gradual shift from bullish to bearish sentiment, forming a dome-like shape as prices rise, consolidate, and then start to decline. A decisive break below the support level at the base of the pattern confirms the reversal, suggesting that sellers have taken control and downward momentum may strengthen.
On Tuesday, the stock slipped below the key support level of Rs 299 and continued to trade below this level on Wednesday. This breakdown, along with sustained trading beneath the support, confirms the presence of bearish momentum.
For a rounding top, the downside target is typically estimated by measuring the vertical distance from the peak of the dome to the base and projecting that distance downward from the breakout point. Traders often use this projection to set profit targets, booking partial or full gains as prices approach potential support levels while monitoring for signs of further weakness.
Indicator Confirmation
MACD: The orange signal line crossed above the Blue MACD line, with the histogram turning red, indicating bearish momentum.
Moving Averages: On the 4-hour time frame, the 5-day moving average has crossed below the 9-day moving average, further confirming a bearish trend.
Implications
The breakdown from the bearish rounding top pattern signals potential for further downside. A sustained close below the key Rs 299 level, ideally supported by higher selling volumes, would confirm the breakdown and lower the chances of a false signal. The earlier support near Rs 299 has now turned into immediate resistance, and continued trading below this level would strengthen bearish control in the near term.
About the stock
L&T Finance Limited (LTF) is a Mumbai-based NBFC and a subsidiary of Larsen & Toubro Limited, one of India’s leading conglomerates. The company offers a wide range of digital-first financial products across urban and rural markets, including home, personal, and two-wheeler loans. Its portfolio also spans microfinance, farm and SME financing, serving individuals, farmers, and small businesses across India. Over the past month, LTF Ltd has slipped 3.62%, but it remains up 43% over the last six months and has delivered a strong 119.88% gain over the past year.
Disclaimer: The views and investment tips expressed by investment experts/broking houses/rating agencies on tradebrains.in are their own, and not that of the website or its management. Investing in equities poses a risk of financial losses. Investors must therefore exercise due caution while investing or trading in stocks. Trade Brains Technologies Private Limited or the author are not liable for any losses caused as a result of the decision based on this article. Please consult your investment advisor before investing.
For more such technical stock ideas, Click here to view our research page.
The post L&T Finance forms Bearish Rounding Pattern; Check the support and resistance appeared first on Trade Brains.
What's Your Reaction?