


Technical View: Retail Stock Showing a Bullish Pattern to Keep an Eye On
Synopsis: Vishal Mega Mart Ltd has formed a descending channel pattern on the 1-hour chart, and a breakout to the upside from this channel indicates a bullish bias. VMM, after a phase of controlled decline in recent sessions, has formed a descending channel pattern on its 1-hour chart, with an upside breakout indicating a potential […] The post Technical View: Retail Stock Showing a Bullish Pattern to Keep an Eye On appeared first on Trade Brains.


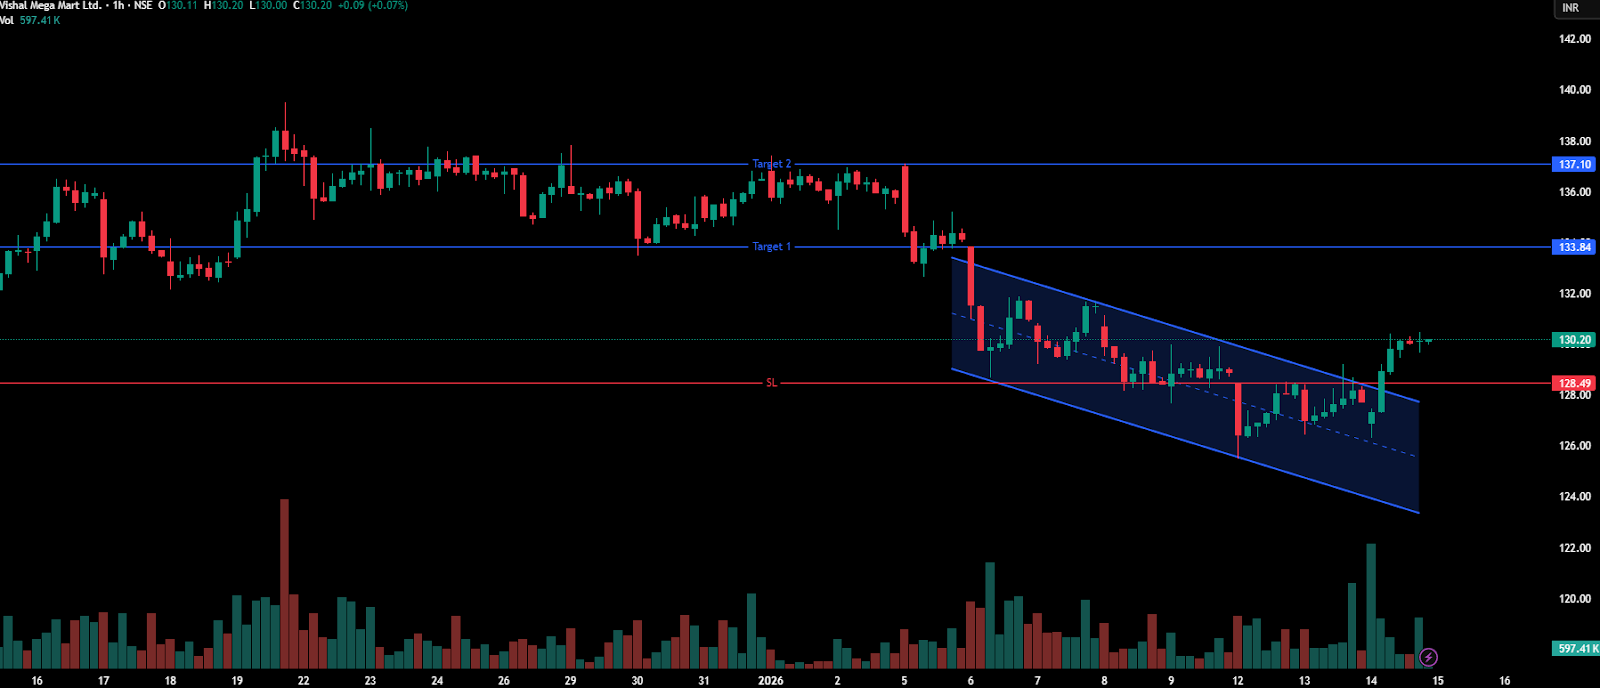
Synopsis: Vishal Mega Mart Ltd has formed a descending channel pattern on the 1-hour chart, and a breakout to the upside from this channel indicates a bullish bias.
VMM, after a phase of controlled decline in recent sessions, has formed a descending channel pattern on its 1-hour chart, with an upside breakout indicating a potential bullish reversal and continuation of upward momentum.
The descending channel pattern represents a short-term downtrend where price moves between parallel downward-sloping support and resistance levels. A decisive breakout above the upper boundary signals a bullish reversal, indicating that buyers are gaining control, and upside momentum may accelerate.
On Wednesday, the stock formed a higher low within the descending channel pattern before decisively breaking above the key resistance level of Rs 128.5. The breakout, supported by healthy buying volumes, signals the emergence of near-term bullish momentum.
For a descending channel pattern breakout to the upside, the upside target is typically determined by identifying immediate resistance levels above the breakout point. Traders often use these resistance zones to set profit targets, booking partial or full gains near these levels while monitoring price action for signs of continued strength or potential reversal.
Indicator Confirmation
RSI: The daily RSI indicates a bullish reversal, as it increased from 33.42 in the previous trading session to 40.36 on Wednesday, confirming the uptick momentum.
MACD: The Blue MACD line crossed above the orange signal line, with the histogram turning green, indicating bullish momentum.
Moving Averages: On the 1-hour time frame, the 5-day moving average has crossed above the 9-day moving average, further confirming a bullish trend.
Price Volume Trend: The Price Volume Indicator confirmed the uptrend, supported by a rise in buying volumes.
Implications
The breakout from the descending channel indicates scope for further upside. A sustained close above the key Rs 128.5 resistance, preferably accompanied by increased buying volume, would confirm the validity of the breakout and reduce the risk of a false signal. The former resistance around Rs 128.5 has now turned into immediate support, and continued trading above this level would reinforce bullish control in the near term.
About the stock
Vishal Mega Mart Limited is a value retail chain serving middle- and lower-middle-income consumers in India. It offers apparel, general merchandise, and FMCG through its own and third-party brands and operates a pan-India value retail chain with 742 stores across 30 states/UTs and 493 cities, covering 12.76 million sq. ft. VMM boasts 157 million registered loyalty customers and 695 Stores with hyperlocal delivery.
Over the past month, Vishal Mega Mart Limited has declined by 2.64%, reflecting a phase of prolonged downtrend. The stock is down 5.03% over the last six months and has registered a 23.73% gain over the past year.
For more such technical stock ideas, click here to view our research page.
Disclaimer: The views and investment tips expressed by investment experts/broking houses/rating agencies on tradebrains.in are their own, and not that of the website or its management. Investing in equities poses a risk of financial losses. Investors must therefore exercise due caution while investing or trading in stocks. Trade Brains Technologies Private Limited or the author are not liable for any losses caused as a result of the decision based on this article. Please consult your investment advisor before investing.
The post Technical View: Retail Stock Showing a Bullish Pattern to Keep an Eye On appeared first on Trade Brains.
What's Your Reaction?