


NMDC Steel Forms A Double-Bottom Pattern Hinting At A Near-Term Bullish Reversal; Check The Details
Synopsis: NMDC Steel Ltd has formed a double-bottom pattern on the weekly chart, signalling a potential near-term bullish reversal. A double bottom chart pattern is a bullish reversal pattern, shaped like the letter “W”, indicating that a downtrend may be losing momentum and shifting toward an uptrend. The chart shows a bullish breakout above the […] The post NMDC Steel Forms A Double-Bottom Pattern Hinting At A Near-Term Bullish Reversal; Check The Details appeared first on Trade Brains.


Synopsis: NMDC Steel Ltd has formed a double-bottom pattern on the weekly chart, signalling a potential near-term bullish reversal.
A double bottom chart pattern is a bullish reversal pattern, shaped like the letter “W”, indicating that a downtrend may be losing momentum and shifting toward an uptrend. The chart shows a bullish breakout above the key resistance zone near Rs 49.65, supported by strong buying momentum and rising volumes.
NMDC Steel Ltd moved above the double-bottom resistance neckline on June 1st, 2026, and sustained itself above the key resistance level and closed at Rs 52.45 on June 3rd in the weekly chart. Sustaining above the Rs 49.65 support level signals near-term bullish momentum and potential for further upside.
In a double bottom pattern, traders typically target the next resistance level above the neckline, where traders may consider booking profits while monitoring momentum for continuation or signs of fading.
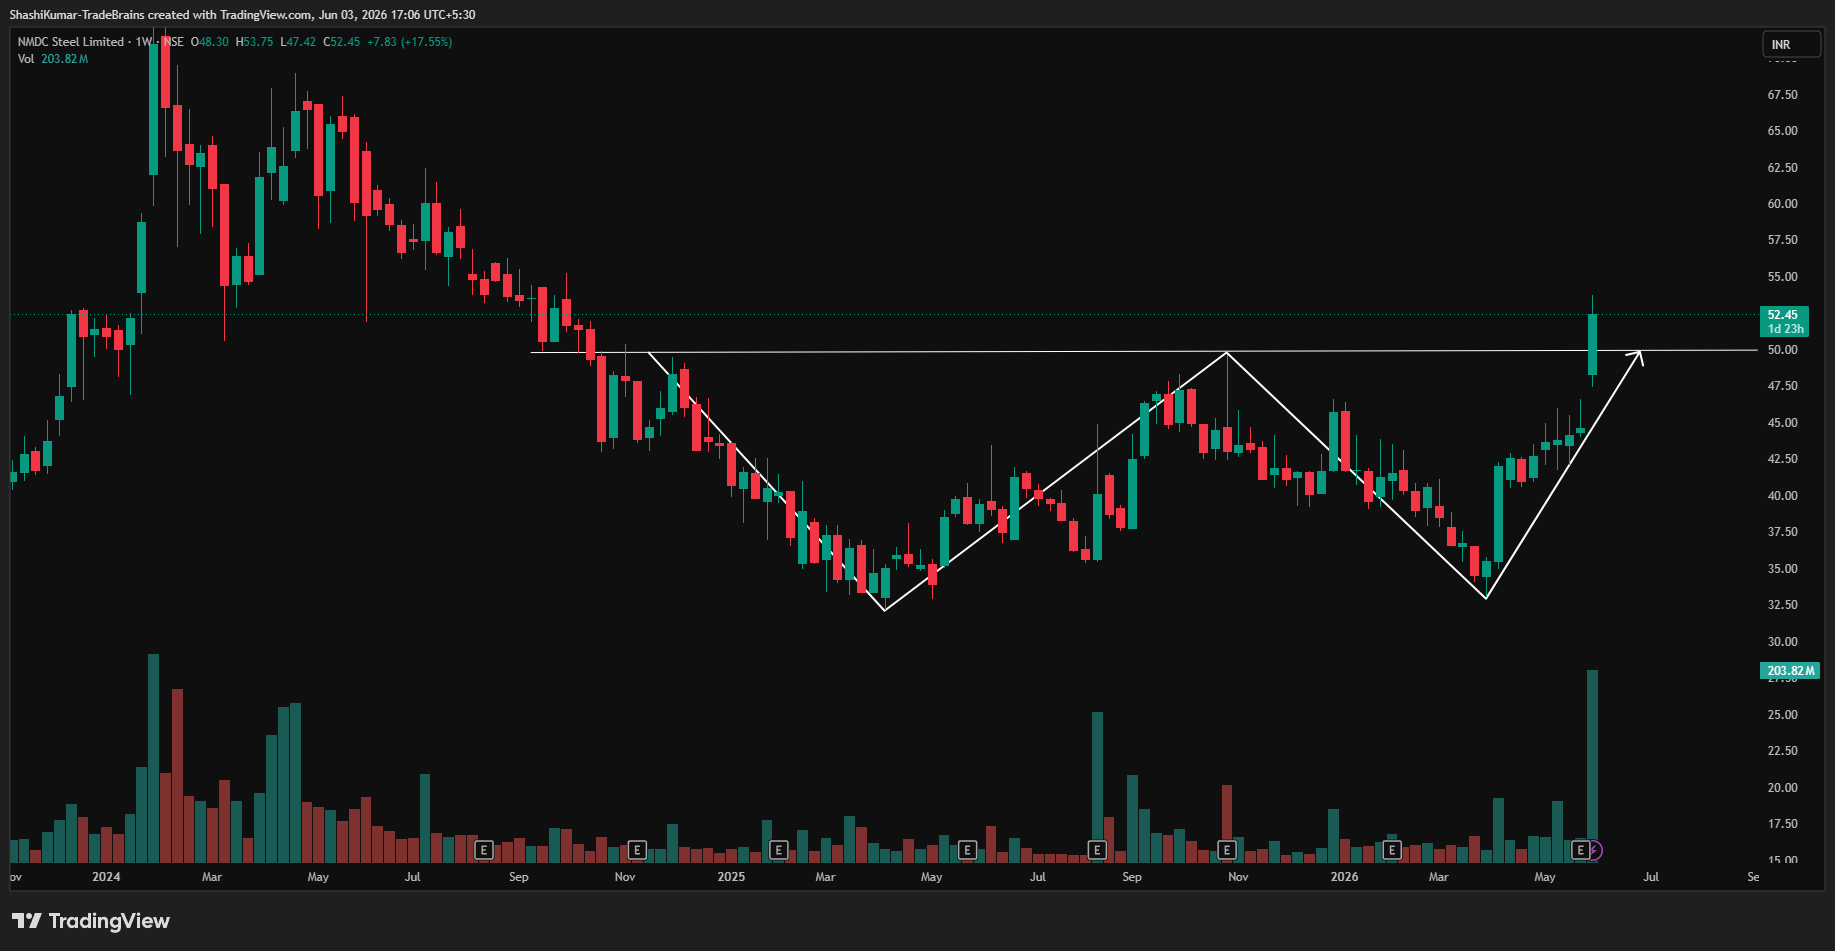
NMDC Steel Ltd Chart: Weekly Timeframe
Indicator Confirmation
- RSI: The weekly RSI indicates a bullish reversal, as it rose from 58.77 in the previous week’s trading session to 70.92 on Wednesday, which is in the overbought zone.
- MACD: On the weekly time frame, the blue MACD line was above the orange signal line, with the histogram turning green, indicating bullish momentum.
- Moving Averages: On the weekly time frame, the 5-day EMA was above the 9-day EMA, further confirming a bullish trend.
- Price Volume Trend: The Price Volume Indicator confirms the uptrend, accompanied by a sharp increase in buying volume in the weekly time frame.
- On-Balance Volume: The rising OBV and rising price confirmed the trend is a strong, sustainable upward trend driven by high buying pressure in the weekly time frame.
Implications
A double-bottom pattern signals a possible upward move. A strong, high-volume close above Rs 49.65 would confirm the reversal, and sustaining above this level as support would strengthen the near-term bullish outlook.
About the stock
Established in 2015, NMDC Steel Limited is a Central Public Sector Enterprise operating under the Ministry of Steel. Headquartered at Nagarnar in Chhattisgarh, the company owns and runs a state-of-the-art 3.0 MTPA steel plant. The company primarily manufactures and supplies high-quality hot-rolled (HR) steel coils, strips, and plates used in construction, automotive, shipbuilding, and petroleum pipelines.
In the past month, NMDC Steel Ltd stock has gained 21.90%. The stock rose 25.74% over the last six months and delivered 36.17% compared to a year ago. For more such technical stock ideas, clickhereto view our research page.
Disclaimer: The views and investment tips expressed by investment experts/broking houses/rating agencies on tradebrains.in are their own, and not that of the website or its management. Investing in equities poses a risk of financial losses. Investors must therefore exercise due caution while investing or trading in stocks. Trade Brains Technologies Private Limited or the author are not liable for any losses caused as a result of the decision based on this article. Please consult your investment advisor before investing.
The post NMDC Steel Forms A Double-Bottom Pattern Hinting At A Near-Term Bullish Reversal; Check The Details appeared first on Trade Brains.
What's Your Reaction?