


Reliance Industries Makes Bullish Engulfing Pattern; Check the Chart and Details
Synopsis: Reliance Industries Ltd formed a Bullish Engulfing pattern on the 1-hour chart, signaling a potential near-term bullish reversal. The Bullish Engulfing pattern signals momentum reversal, as buyers overpower sellers after weakness, supporting bullish potential. A Bullish Engulfing pattern signals a potential reversal after recent weakness. The strong bullish candle engulfing the prior bearish one […] The post Reliance Industries Makes Bullish Engulfing Pattern; Check the Chart and Details appeared first on Trade Brains.


Synopsis: Reliance Industries Ltd formed a Bullish Engulfing pattern on the 1-hour chart, signaling a potential near-term bullish reversal.
The Bullish Engulfing pattern signals momentum reversal, as buyers overpower sellers after weakness, supporting bullish potential. A Bullish Engulfing pattern signals a potential reversal after recent weakness. The strong bullish candle engulfing the prior bearish one shows a shift in sentiment as buyers regain control. Renewed buying interest improves confidence, and sustained strength above the pattern’s high may drive further upside momentum.
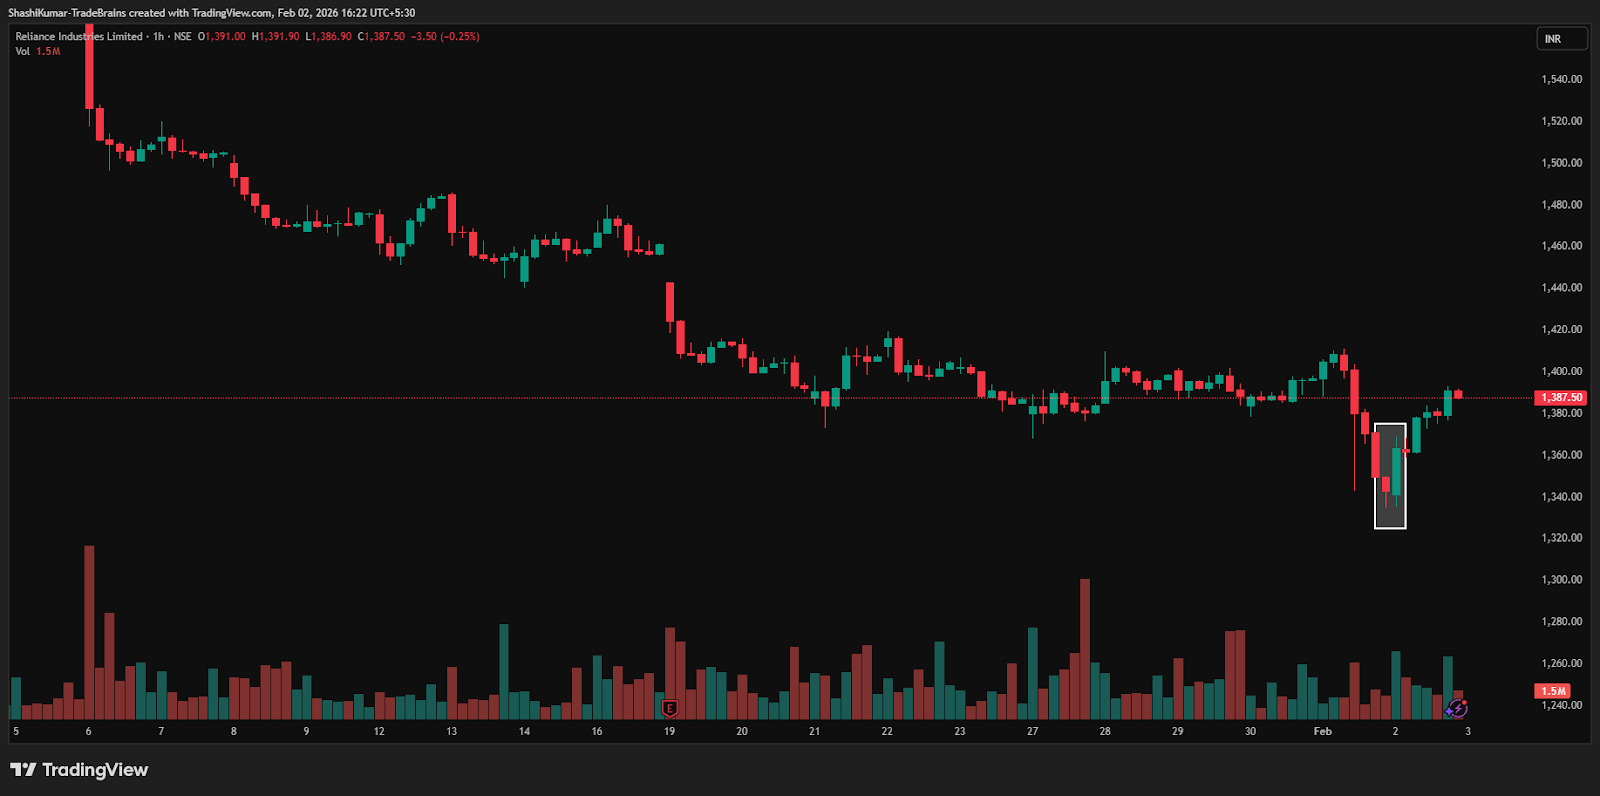
On Monday, Reliance Industries Ltd formed a Bullish Engulfing pattern on the 1-hour chart after a brief corrective phase. The strong green candle was supported by above-average volumes, saw a 62% increase in volume activity on Monday compared to previous session. A sustained move above 1,363 could trigger further upside, while a drop below 1,363 would weaken the bullish outlook.
In a Bullish Engulfing pattern, targets are usually set near the nearest overhead resistance after the reversal. Traders may trail profits as price rises, booking partial or full gains around key resistance levels, while monitoring follow-through strength and volume for confirmation or early exhaustion signs.
Reliance Industries Ltd Chart: 1-hour Timeframe
Indicator Confirmation
RSI: The daily RSI indicates bullish momentum, as it rose from 25 in the previous trading session to 38 on Monday, confirming the bullish reversal.
MACD: On 1-hour time frame, the Blue MACD line crossed above the orange signal line, with the histogram turning green, indicating bullish momentum.
Moving Averages: On the 1-hour time frame, the 5-day moving average has crossed above the 9-day moving average, further confirming a bullish trend.
Price Volume Trend: The Price Volume Indicator confirms the uptrend, accompanied by a sharp increase in buying volume in daily time frame.
Implications
The formation of a Bullish Engulfing pattern points to potential upside for Reliance Industries Ltd. A sustained move above the key 1,363 level, preferably on strong buying volumes, would confirm the reversal and reduce the risk of a false signal. Holding above this level would reinforce near-term bullish momentum.
About the stock
Reliance Industries is a diversified Indian multinational conglomerate with a significant presence across energy, digital services, and retail. Its core segments include Oil to Chemicals (O2C), Exploration and Production (E&P), and rapidly growing consumer-facing businesses like Jio Platforms, Reliance Retail, and FMCG. The company is also making significant strides in New Energy with its integrated solar and battery gigafactories.
Over the past month, Reliance Industries Ltd share price has fallen 12.83%, indicating sustained weakness. Over the last six months, the stock declined 1.66%, while it remains up 11.41% compared to the same period last year. For more such technical stock ideas, click here to view our research page.
The post Reliance Industries Makes Bullish Engulfing Pattern; Check the Chart and Details appeared first on Trade Brains.
What's Your Reaction?