


Solana (SOL) Recovery Shows Strength After Breaking Initial Resistance Level
Solana failed to settle above $85 and trimmed some gains. SOL price is now recovering losses from $76 and showing a few positive signs. SOL price started a decent recovery wave above $78 and $80 against the US Dollar. The price is now trading above $80 and the 100-hourly simple moving average. There was a break above a key bearish trend line with resistance at $81 on the hourly chart of the SOL/USD pair (data source from Kraken). The price could continue to move up if it clears $82 and $84. Solana Price Attempts Recovery Solana price remained stable and started a decent recovery wave above $78, like Bitcoin and Ethereum. SOL was able to climb above the $80 level. There was a move above the 50% Fib retracement level of the downward move from the $86.68 swing high to the $75.64 low. Besides, there was a break above a key bearish trend line with resistance at $81 on the hourly chart of the SOL/USD pair. However, the bears are active near $82.50 and the 61.8% Fib retracement level of the downward move from the $86.68 swing high to the $75.64 low. Solana is now trading above $80 and the 100-hourly simple moving average. On the upside, immediate resistance is near the $82 level. The next major resistance is near the $84 level. The main resistance could be $85. A successful close above the $85 resistance zone could set the pace for another steady increase. The next key resistance is $92. Any more gains might send the price toward the $95 level. Another Decline In SOL? If SOL fails to rise above the $82 resistance, it could continue to move down. Initial support on the downside is near the $80 zone. The first major support is near the $79 level. A break below the $79 level might send the price toward the $77 support zone. If there is a close below the $77 support, the price could decline toward the $74 zone in the near term. Technical Indicators Hourly MACD – The MACD for SOL/USD is gaining pace in the bullish zone. Hourly Hours RSI (Relative Strength Index) – The RSI for SOL/USD is above the 50 level. Major Support Levels – $80 and $77. Major Resistance Levels – $82 and $85.

Solana failed to settle above $85 and trimmed some gains. SOL price is now recovering losses from $76 and showing a few positive signs.
- SOL price started a decent recovery wave above $78 and $80 against the US Dollar.
- The price is now trading above $80 and the 100-hourly simple moving average.
- There was a break above a key bearish trend line with resistance at $81 on the hourly chart of the SOL/USD pair (data source from Kraken).
- The price could continue to move up if it clears $82 and $84.
Solana Price Attempts Recovery
Solana price remained stable and started a decent recovery wave above $78, like Bitcoin and Ethereum. SOL was able to climb above the $80 level.
There was a move above the 50% Fib retracement level of the downward move from the $86.68 swing high to the $75.64 low. Besides, there was a break above a key bearish trend line with resistance at $81 on the hourly chart of the SOL/USD pair.
However, the bears are active near $82.50 and the 61.8% Fib retracement level of the downward move from the $86.68 swing high to the $75.64 low. Solana is now trading above $80 and the 100-hourly simple moving average.
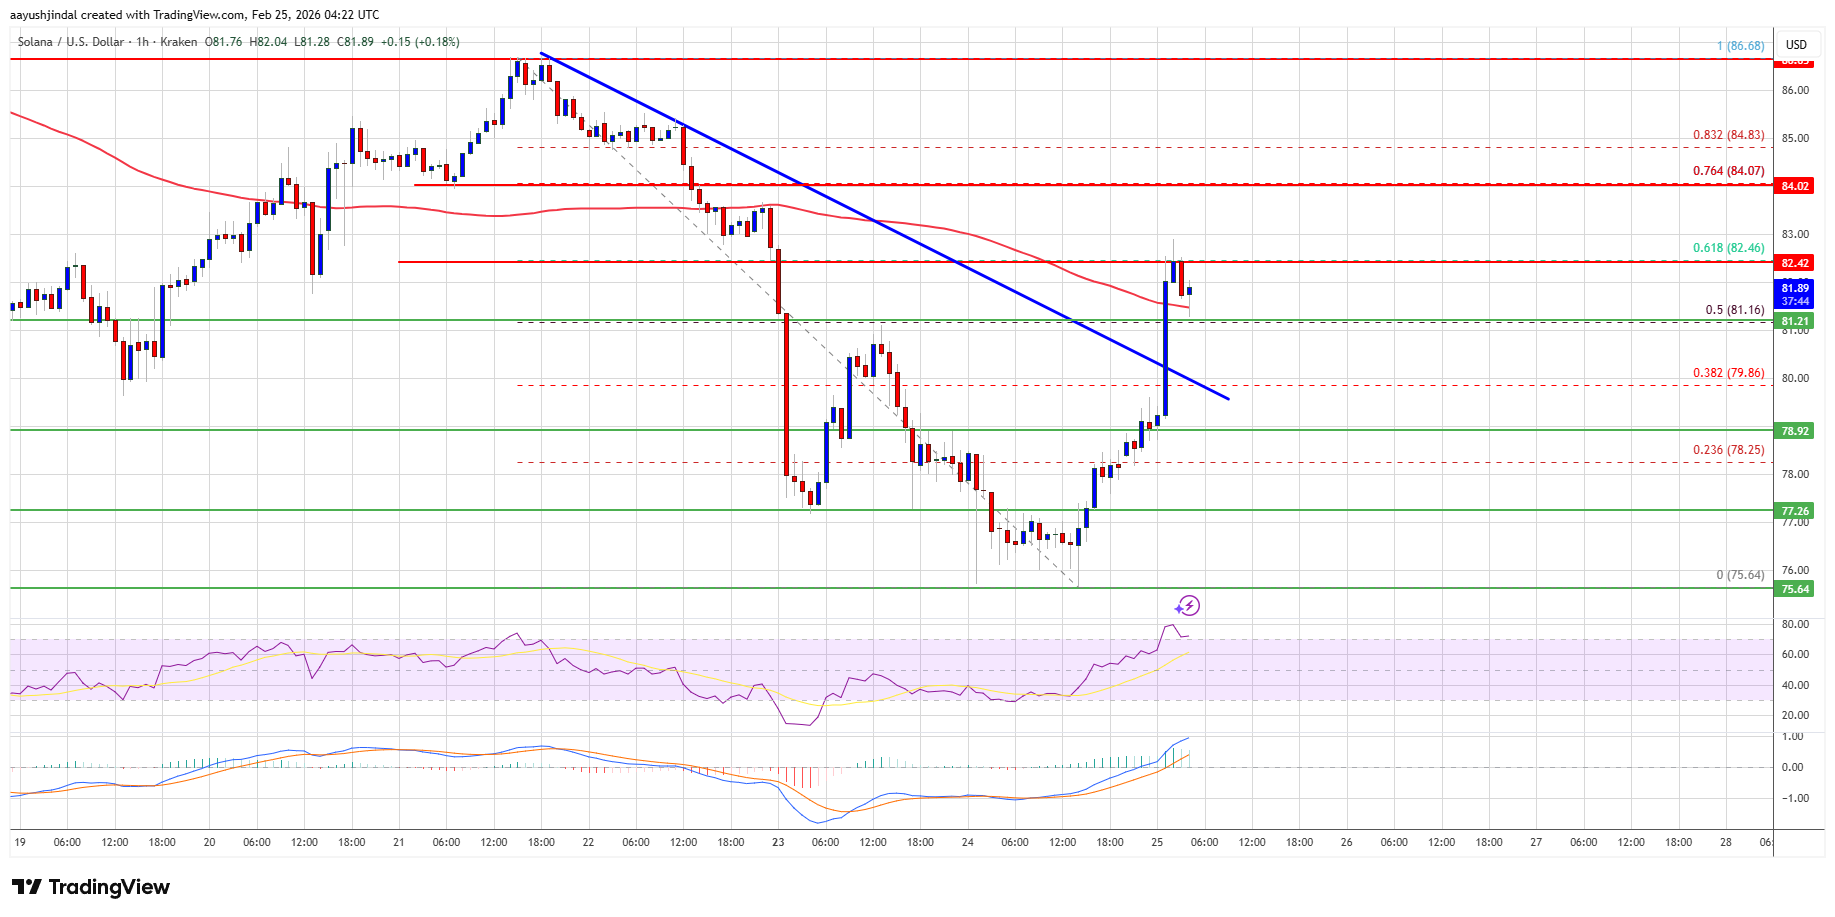
On the upside, immediate resistance is near the $82 level. The next major resistance is near the $84 level. The main resistance could be $85. A successful close above the $85 resistance zone could set the pace for another steady increase. The next key resistance is $92. Any more gains might send the price toward the $95 level.
Another Decline In SOL?
If SOL fails to rise above the $82 resistance, it could continue to move down. Initial support on the downside is near the $80 zone. The first major support is near the $79 level.
A break below the $79 level might send the price toward the $77 support zone. If there is a close below the $77 support, the price could decline toward the $74 zone in the near term.
Technical Indicators
Hourly MACD – The MACD for SOL/USD is gaining pace in the bullish zone.
Hourly Hours RSI (Relative Strength Index) – The RSI for SOL/USD is above the 50 level.
Major Support Levels – $80 and $77.
Major Resistance Levels – $82 and $85.
What's Your Reaction?