


Technical View: Nifty, Bank Nifty & Sensex Trade Setup and Key levels to watch for 31st October
On Thursday, Indian equity markets extended their decline, with both the Nifty 50 and Sensex ending lower after a volatile trading session. Despite opening on a muted note and briefly attempting to recover intraday, the benchmarks slipped into negative territory by the close, reflecting profit-booking across major sectors. While both indices continued to hold above […] The post Technical View: Nifty, Bank Nifty & Sensex Trade Setup and Key levels to watch for 31st October appeared first on Trade Brains.


On Thursday, Indian equity markets extended their decline, with both the Nifty 50 and Sensex ending lower after a volatile trading session. Despite opening on a muted note and briefly attempting to recover intraday, the benchmarks slipped into negative territory by the close, reflecting profit-booking across major sectors. While both indices continued to hold above their key moving averages, suggesting underlying technical support, overall sentiment remained cautious amid mixed global cues and selective sectoral performance.
Broader market trends were largely negative, with most sectoral indices ending in the red. Energy and midcap stocks were among the few bright spots, supported by strong performances from select companies following earnings announcements. In contrast, services, financials, private banks, and healthcare sectors witnessed notable declines, weighing on the benchmarks. Global markets offered little support, as Asian indices showed a mixed trend and U.S. futures traded lower, keeping investor sentiment subdued through the session.
In this overview, we will analyse the key technical levels and trend directions for Nifty and BSE Sensex to monitor in the upcoming trading sessions. All the charts mentioned below are based on the 5-minute timeframe.
Nifty 50
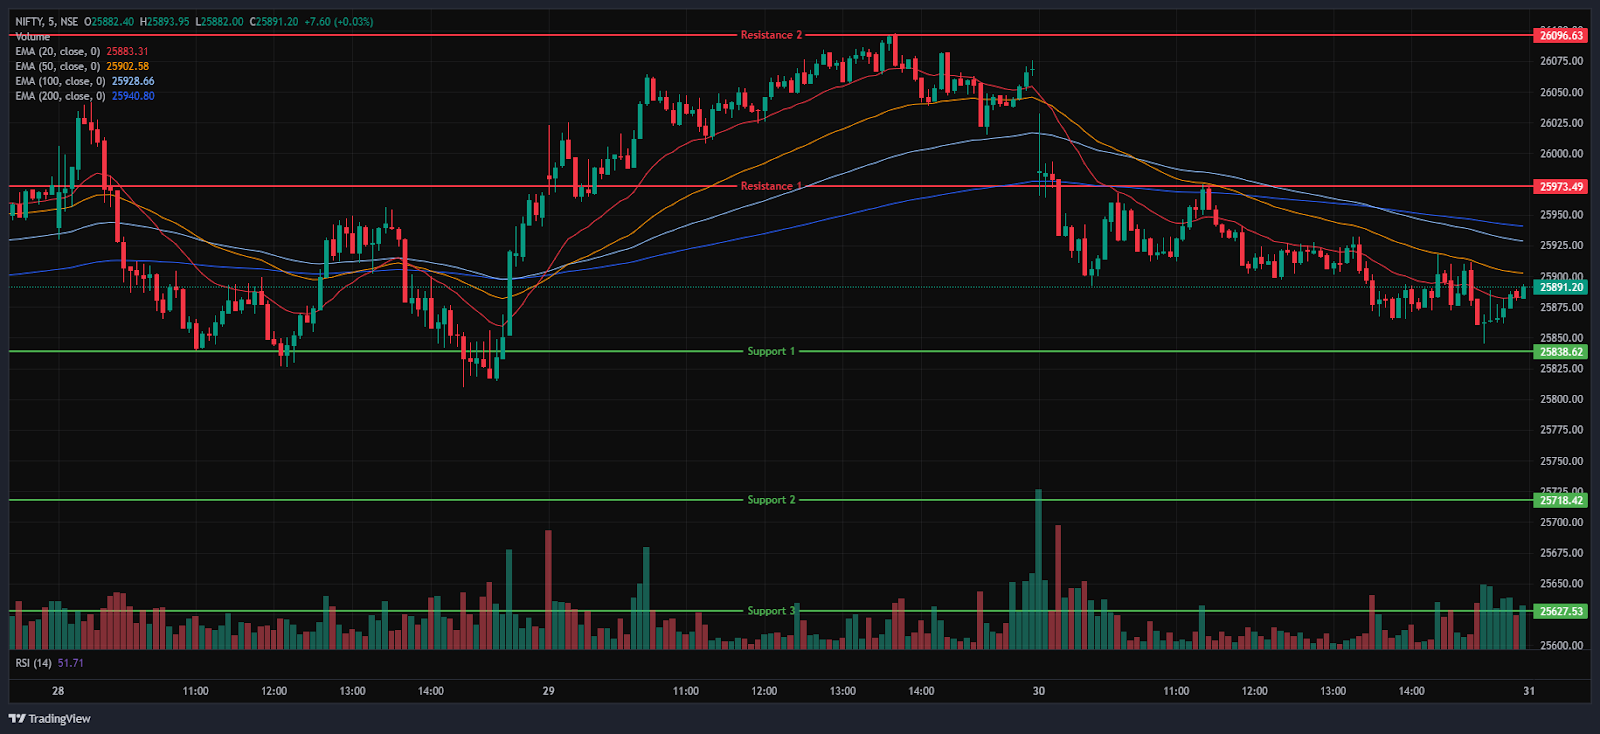
(In this analysis, we have used 20/50/100/200 EMAs, where 20 EMA (Red), 50 EMA (Orange), 100 EMA (Light Blue), and 200 EMA (Dark Blue)).
To view other technical reports, click here
The Nifty 50 Index opened on a negative note at 25,984.40 on Thursday, down by 69.5 points from Wednesday’s closing of 26,053.90. The index opened on a bearish note and was dragged down below the 25,900 level in the morning session. During the morning session, the index traded within the 25,850-26,050 range, traded below the EMAs of 20/50/100, but remained above the 200 EMA in the 15-minute chart.
In the afternoon, the index continued its downward momentum and fell as low as 25,845, marking its day low. Overall, the Index traded within a 25,800-25,950 range throughout the session. During the afternoon session, the Nifty 50 closed below the EMAs of 20/50/100, but remained above the 200 EMA in the 15-minute time frame. The Nifty’s immediate resistance levels are R1 (25,973) and R2 (26,097), while immediate support levels are S1 (25,839), S2 (25,718) and S3 (25,627).
The Nifty index had reached a day’s high at 26,032.05 and saw a day’s low at 25,845.25. Finally, it had closed at 25,877.85, in the red below the 25,900 level, losing 176.05 points, or 0.68%. The Nifty 50 closed above all four EMAs of 20/50/100/200 in the daily time frame.
Momentum Indicators
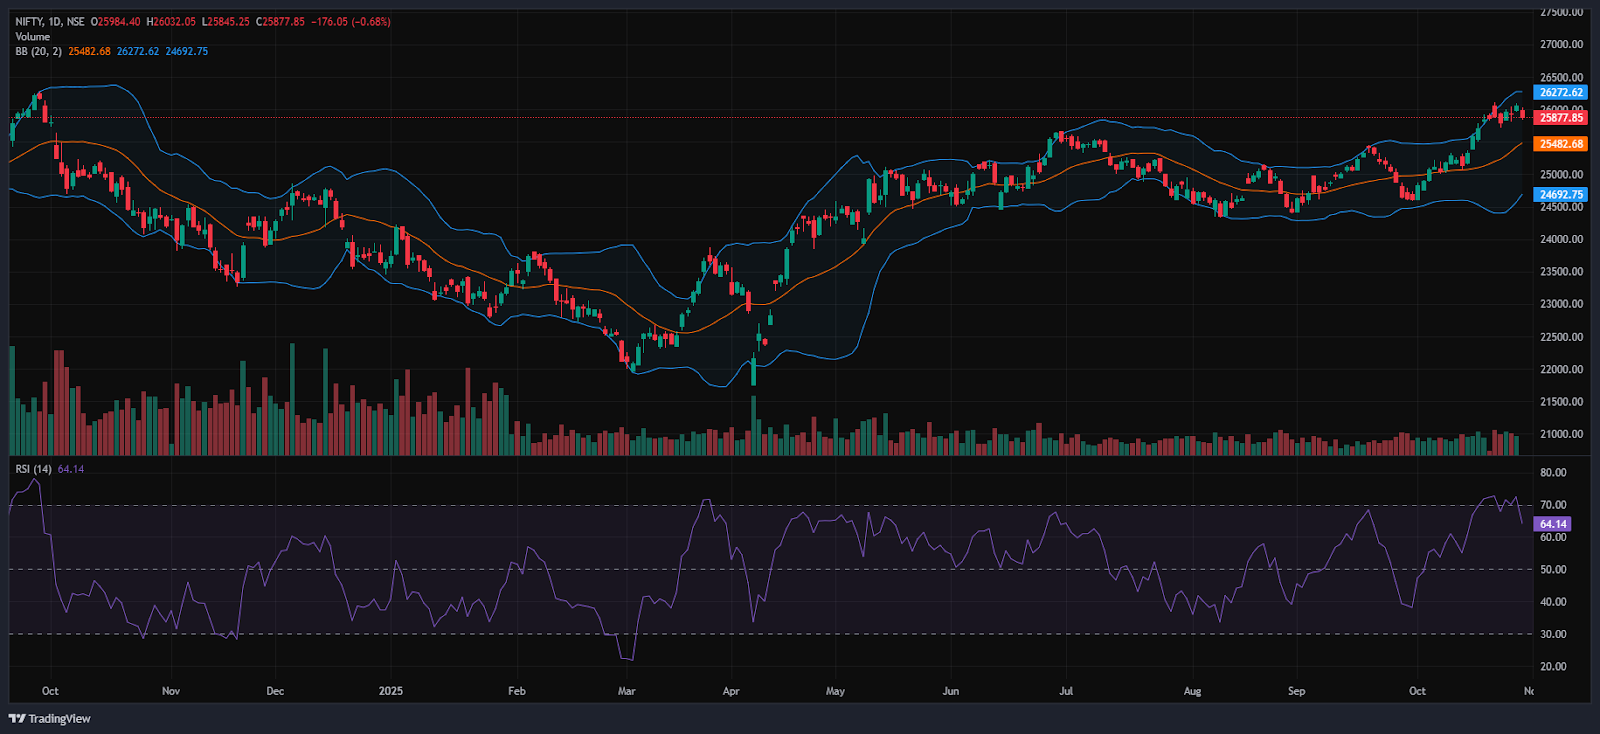
RSI (Daily): The Nifty 50’s RSI stood at 64.14, which is above the overbought zone of 70, indicating a bullish sentiment.
Bollinger Bands (Daily): The index is trading in the upper band of the Bollinger Band range above the middle band (Simple Moving Average). Its position in the upper range indicates a bullish sentiment, but the Index formed a bearish candle in the daily time frame and took support near 25,845 and 26,032 acted as a resistance level. A sustained move above the middle band signals a bullish sentiment, while a drop back toward the lower band may reinforce bearish sentiment.
Volume Analysis: Thursday’s trading session had an average volume of 257.37 Mn.
Derivatives Data: Options OI indicates strong Put writing at 25,800, followed by 25,700, establishing it as a firm support zone. On the upside, a significant Call OI buildup at 25,900 and 26,000 suggests a potential resistance supply. PCR (Put/Call Ratio) stands at 0.6 (<1), leaning towards bullish sentiment, and the Long Buildup indicates a Strong Bullish outlook, with an overall bullish outlook for the next trading session.
Bank Nifty
(In this analysis, we have used 20/50/100/200 EMAs, where 20 EMA (Red), 50 EMA (Orange), 100 EMA (Light Blue), and 200 EMA (Dark Blue)).
The Bank Nifty Index started the session on a negative note at 58,152.05 on Thursday, down by 233.2 points from Wednesday’s closing of 58,385.25. The index started on a Bearish note and dragged down to the 58,077 level in the morning session and was trading in the range of 58,050-58,350. In addition, the index was trading above the EMAs of 100/200 and below the 20/50 EMAs in the 15-minute time frame in the morning session.
In the afternoon session, the Index lost its momentum and fell as low as 57,999 marking its day low. Further, the Index was trading in the range of 57,950-58,300, ended in red. During the afternoon session, Bank Nifty closed below the EMAs of 20/50/100 but remained above the 200 EMA in the 15-minute time frame. The Bank Nifty’s immediate resistance levels are R1 (58,287) and R2 (58,577), while immediate support levels are S1 (57,999), S2 (57,768), and S3 (57,479).
The Bank Nifty index had peaked at 58,331.20 and made a day’s low at 57,999.20. Finally, it had closed in red at 58,031.10, closing below the 58,100 level, losing 354.15 points or 0.61%. The Relative Strength Index (RSI) stood at 66.98, below the overbought zone of 70 in the daily time frame, and Bank Nifty closed above all four EMAs of 20/50/100/200 in the daily time frame.
Sensex
(In this analysis, we have used 20/50/100/200 EMAs, where 20 EMA (Red), 50 EMA (Orange), 100 EMA (Light Blue), and 200 EMA (Dark Blue)).
To view other technical reports, click here
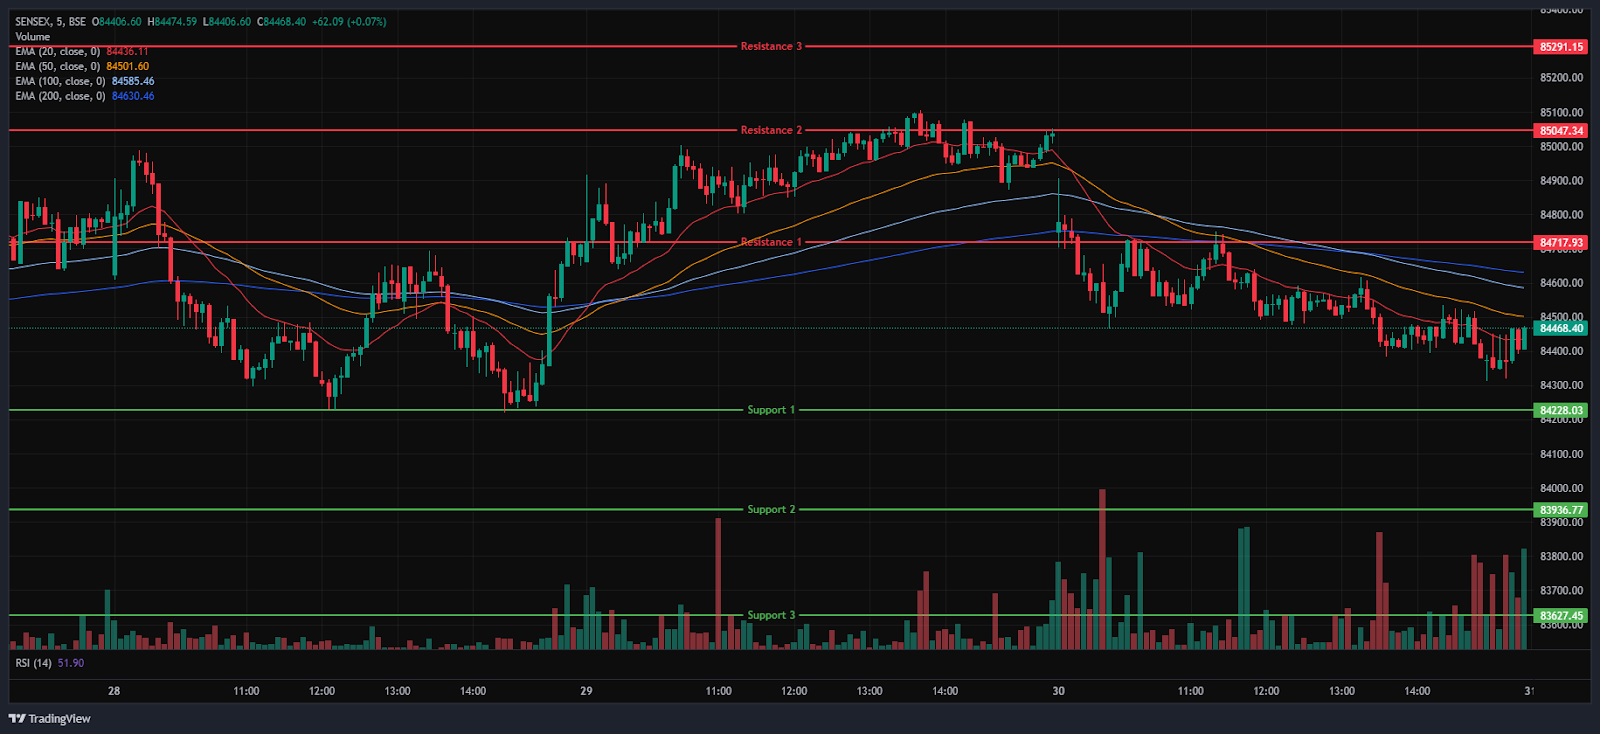
The BSE Sensex Index also opened on a negative note at 84,750.90 on Thursday, down by 246.23 points from Wednesday’s closing of 84,997.13. The index started its session on a bearish note and fell below the 84,500 mark. The Index was trading within the 84,400-84,950 range and was trading below the EMAs of 20/50/100, but remained above the 200 EMA in the 15-minute time frame in the morning session.
In the afternoon session, the Index further pulled down and fell as low as 84,313, marking its day low. The Index was trading in the 84,300-84,650 range, maintaining its overall bearish trend and closing below the EMAs of 20/50/100, but it remained above the 200 EMA in the 15-minute time frame. The BSE Sensex immediate resistance levels are R1 (84,718), R2 (85,047) and R3 (85,291), while immediate support levels are S1 (84,228), S2 (83,937), and S3 (83,627).
The BSE Sensex index had peaked at 84,906.95 and made a day’s low at 84,312.65. Finally, it had closed at 84,404.46 in red, losing 592.67 points or 0.70%. The Relative Strength Index (RSI) stood at 63.26, below the overbought zone of 70 in the daily time frame, and the BSE Sensex closed above all four EMAs of 20/50/100/200 in the daily time frame.
India VIX
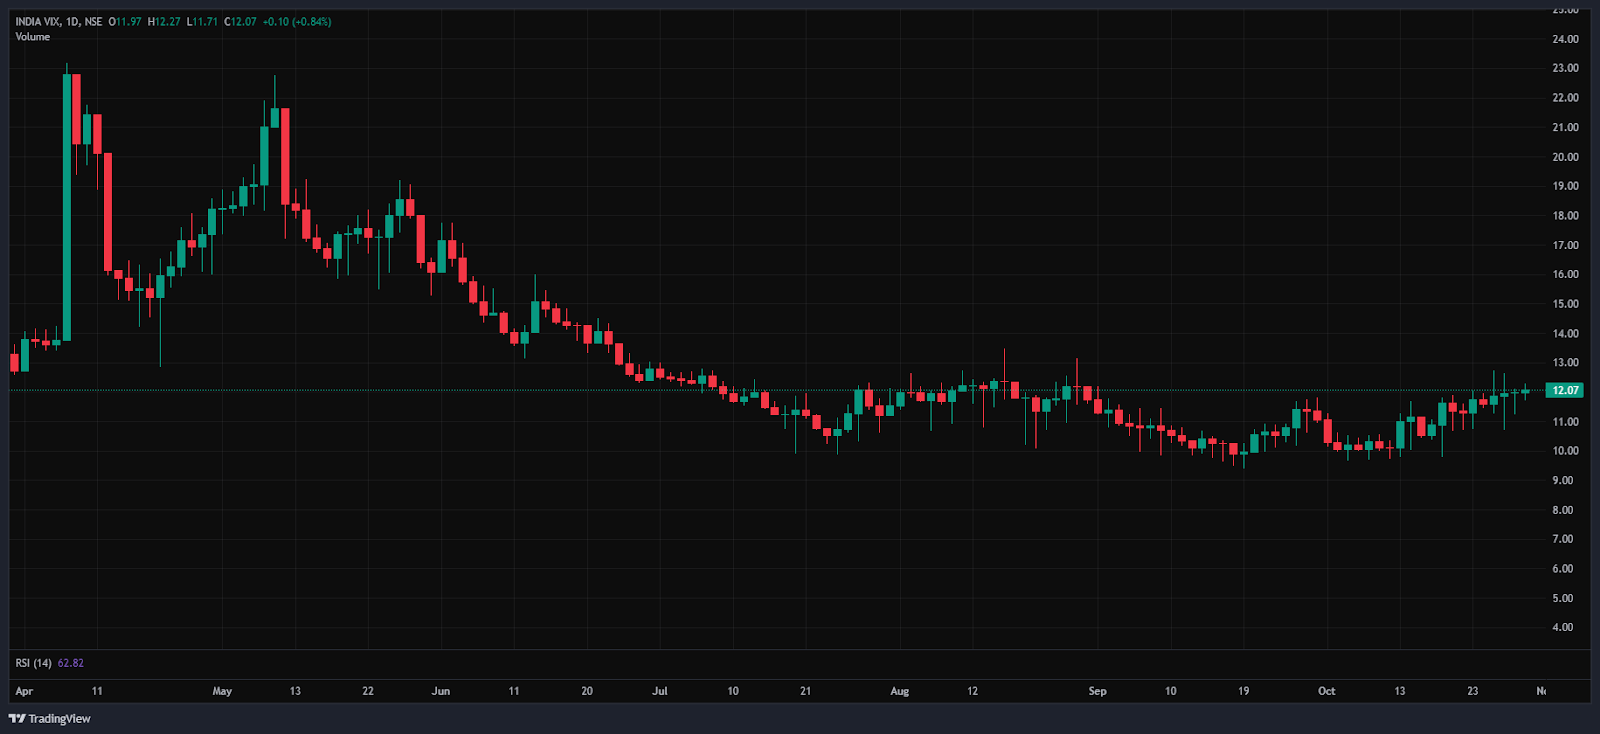
The India VIX increased by 0.095 points or 0.79%, from 11.97 to 12.07 during Thursday’s session. An increase in the India VIX typically indicates higher price volatility in the stock market, suggesting a less stable market environment. However, a stable market environment and minimal volatility are anticipated when the India VIX is below 15.
Market Recap – 30th October 2025
On Thursday, the Nifty 50 opened slightly higher at 25,984.40, down -69.50 points from its previous close of 26,053.90. The index hit an intraday high of 26,032.05 and closed at 25,877.85, down -176.05 points, or -0.68%. The index remained above all key moving averages (20/50/100/200-day EMAs) on the daily chart, indicating some technical support. The BSE Sensex mirrored the Nifty’s trend, opening at 84,750.90, down -246.23 points from the previous close of 84,997.13. It followed a similar pattern, closing at 84,404.46, a fall of -592.67 points, or -0.70%.
Both indices showed high momentum, with RSI values for Nifty 50 at 64.14 and Sensex at 63.26, below the overbought threshold of 70. The market declined on Thursday due to multiple factors, including the US Federal Reserve’s rate cut accompanied by caution on its December policy outlook, profit booking as the Sensex and Nifty approached their record highs, the monthly F&O expiry for the Sensex, and weak cues from Asian markets.
The majority of indices were in red on Thursday, with a few in green. The Nifty Energy index was the biggest gainer, rising 0.12% or 44.65 points, and standing at 36,392.60. Stocks such as BHEL jumped 6.48% on Thursday, after Q2 results were announced. BHEL turned profitable in Q2FY26, with profit standing at Rs 375 crore, compared to a loss of Rs 455.5 crore in Q1FY26. While other energy stocks like NLC India Ltd, Oil India Ltd, and Bharat Petroleum also gained up to 4.68%.
The Nifty Midcap 50 index was also among the major gainers, rising 0.10% or 17.80 points, and standing at 17,052.25. Stocks such as PB Fintech Ltd rose 7.03%, followed by BHEL and Oil India Ltd, which gained up to 6.48% on Thursday.
The majority of the indices ended in red on Thursday. The Nifty Service Index was the biggest loser, falling -0.84%, or -283.20 points, to 33,509.65. Services Sector stocks like HDFC Life Insurance Company Ltd, Bharti Airtel Ltd, Avenue Supermarts Ltd, and Interglobe Aviation Ltd saw declines of up to -1.93%. The Nifty Financial Services Index also fell on Thursday, losing -211.65 points or -0.77%, ending at 27,376. LIC Housing Finance Ltd fell the most, declining by -3.88%, followed by SBI Cards & Payment Services Ltd, HDFC Life Insurance Company Ltd, and REC Ltd, falling up to -2.77%.
The Nifty Private Bank Index followed the decline, losing -0.74% or -210.55 points, to close at 28,262.9. Banking stocks, including Yes Bank Ltd, HDFC Bank Ltd, Bandhan Bank Ltd, and Axis Bank Ltd, fell up to 2.03%. The Nifty Healthcare Index also fell on Thursday’s trade, ending at 14,825.9, down -105.15 or -0.70%.
Asian markets followed a mixed sentiment on Thursday. Japan’s Nikkei 225 increased by 151.35 points or 0.29%, closing at 51,459. While China’s Shanghai Composite fell by 29.43 points, or 0.74%, to 3,986.90, similarly, Hong Kong’s Hang Seng Index also declined by 63.14 points, or 0.24%, to close at 26,283. Singapore’s Straits Times Index also declined by 2.77 points or 0.06%, finishing at 4,437.44, but South Korea’s KOSPI increased by 5.74 points or 0.14%, closing at 4,086.89. At 4:28 p.m. IST, U.S. Dow Jones Futures were lower, down 0.28%, at 47,498.65, losing 133.35 points.
Trade Setup Summary
The Nifty 50 opened on a negative note at 25,984.40 on Thursday and ended the session in the red below the 25,900 level at 25,877.85. A break below 25,839 could trigger further selling towards 25,718, while breaking the next resistance level of 25,973 could trigger bullishness towards the 26,097 level.
Bank Nifty also started the session on a negative note at 58,152.05 and ended the session in the red at 58,031.10, below the 58,100 level. A break below 57,999 could trigger further selling towards 57,768, while breaking the next resistance level of 58,287 could trigger bullishness towards the 58,577 level.
Sensex also opened on a negative note at 84,750.90 and ended the session in the red at 84,404.46, below the 84,450 level. A break below 84,228 could trigger further selling towards 83,937, while breaking the next resistance level of 84,718 could trigger bullishness towards the 85,047 level.
Given the ongoing volatility and mixed sentiments, it’s advisable to avoid aggressive positions and wait for clear directional moves above resistance or below support. Traders should consider these key support and resistance levels when entering long or short positions following the price break from these critical levels. Additionally, traders can combine moving averages to identify more accurate entry and exit points.
Disclaimer

The views and investment tips expressed by investment experts/broking houses/rating agencies on tradebrains.in are their own, and not that of the website or its management. Investing in equities poses a risk of financial losses. Investors must therefore exercise due caution while investing or trading in stocks. Trade Brains Technologies Private Limited or the author are not liable for any losses caused as a result of the decision based on this article. Please consult your investment advisor before investing.
About: Trade Brains Portal is a stock analysis platform. Its trade name is Dailyraven Technologies Private Limited, and its SEBI-registered research analyst registration number is INH000015729.
Investments in securities are subject to market risks. Read all the related documents carefully before investing.
Registration granted by SEBI and certification from NISM in no way guarantee performance of the intermediary or provide any assurance of returns to investors.
The post Technical View: Nifty, Bank Nifty & Sensex Trade Setup and Key levels to watch for 31st October appeared first on Trade Brains.
What's Your Reaction?