


.png)

XRP Price Stumbles Toward $1.50, Bulls Running Out Of Room
XRP price extended losses and traded below $1.60. The price is now consolidating and might decline further if it remains below $1.50. XRP price started a fresh decline below the $1.650 zone. The price is now trading below $1.60 and the 100-hourly Simple Moving Average. There is a key bearish trend line forming with resistance at $1.650 on the hourly chart of the XRP/USD pair (data source from Kraken). The pair could continue to move down if it stays below $1.650. XRP Price Dives 15% XRP price failed to stay above $1.80 and started a fresh decline, like Bitcoin and Ethereum. The price declined below $1.720 and $1.650 to enter a short-term bearish zone. The price even spiked below $1.550. A low was formed at $1.50, and the price is now consolidating losses. There was a recovery wave above $1.550. The price even cleared the 23.6% Fib retracement level of the downward move from the $1.938 swing high to the $1.50 low. The price is now trading below $1.60 and the 100-hourly Simple Moving Average. If there is a fresh upward move, the price might face resistance near the $1.60 level. The first major resistance is near the $1.650 level. There is also a key bearish trend line forming with resistance at $1.650 on the hourly chart of the XRP/USD pair. A close above $1.650 could send the price to $1.720 or the 50% Fib retracement level of the downward move from the $1.938 swing high to the $1.50 low. The next hurdle sits at $1.770. A clear move above the $1.770 resistance might send the price toward the $1.80 resistance. Any more gains might send the price toward the $1.8350 resistance. The next major hurdle for the bulls might be near $1.90. Another Decline? If XRP fails to clear the $1.60 resistance zone, it could start a fresh decline. Initial support on the downside is near the $1.540 level. The next major support is near the $1.5150 level. If there is a downside break and a close below the $1.5150 level, the price might continue to decline toward $1.50. The next major support sits near the $1.4650 zone, below which the price could continue lower toward $1.420. Technical Indicators Hourly MACD – The MACD for XRP/USD is now gaining pace in the bearish zone. Hourly RSI (Relative Strength Index) – The RSI for XRP/USD is now below the 50 level. Major Support Levels – $1.540 and $1.50. Major Resistance Levels – $1.60 and $1.650.

XRP price extended losses and traded below $1.60. The price is now consolidating and might decline further if it remains below $1.50.
- XRP price started a fresh decline below the $1.650 zone.
- The price is now trading below $1.60 and the 100-hourly Simple Moving Average.
- There is a key bearish trend line forming with resistance at $1.650 on the hourly chart of the XRP/USD pair (data source from Kraken).
- The pair could continue to move down if it stays below $1.650.
XRP Price Dives 15%
XRP price failed to stay above $1.80 and started a fresh decline, like Bitcoin and Ethereum. The price declined below $1.720 and $1.650 to enter a short-term bearish zone.
The price even spiked below $1.550. A low was formed at $1.50, and the price is now consolidating losses. There was a recovery wave above $1.550. The price even cleared the 23.6% Fib retracement level of the downward move from the $1.938 swing high to the $1.50 low.
The price is now trading below $1.60 and the 100-hourly Simple Moving Average. If there is a fresh upward move, the price might face resistance near the $1.60 level. The first major resistance is near the $1.650 level. There is also a key bearish trend line forming with resistance at $1.650 on the hourly chart of the XRP/USD pair.
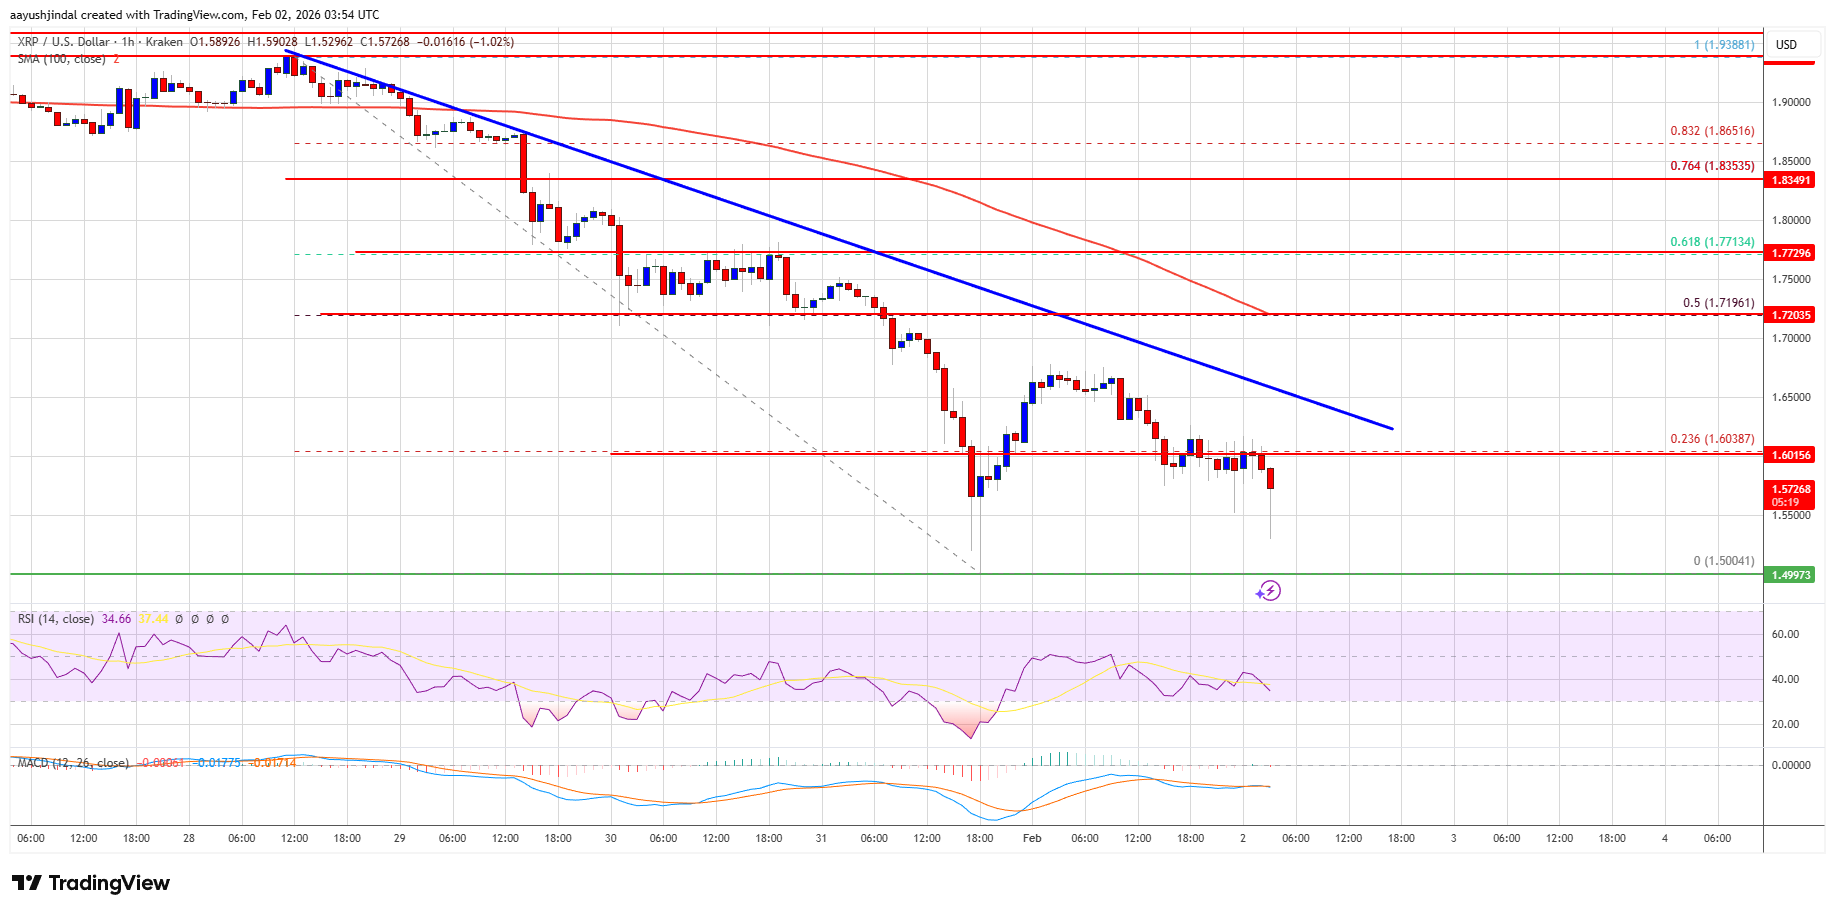
A close above $1.650 could send the price to $1.720 or the 50% Fib retracement level of the downward move from the $1.938 swing high to the $1.50 low. The next hurdle sits at $1.770. A clear move above the $1.770 resistance might send the price toward the $1.80 resistance. Any more gains might send the price toward the $1.8350 resistance. The next major hurdle for the bulls might be near $1.90.
Another Decline?
If XRP fails to clear the $1.60 resistance zone, it could start a fresh decline. Initial support on the downside is near the $1.540 level. The next major support is near the $1.5150 level.
If there is a downside break and a close below the $1.5150 level, the price might continue to decline toward $1.50. The next major support sits near the $1.4650 zone, below which the price could continue lower toward $1.420.
Technical Indicators
Hourly MACD – The MACD for XRP/USD is now gaining pace in the bearish zone.
Hourly RSI (Relative Strength Index) – The RSI for XRP/USD is now below the 50 level.
Major Support Levels – $1.540 and $1.50.
Major Resistance Levels – $1.60 and $1.650.
What's Your Reaction?