


Nifty, Bank Nifty & BSE Sensex Action for 8th of December 2025: Key levels & Trade setups
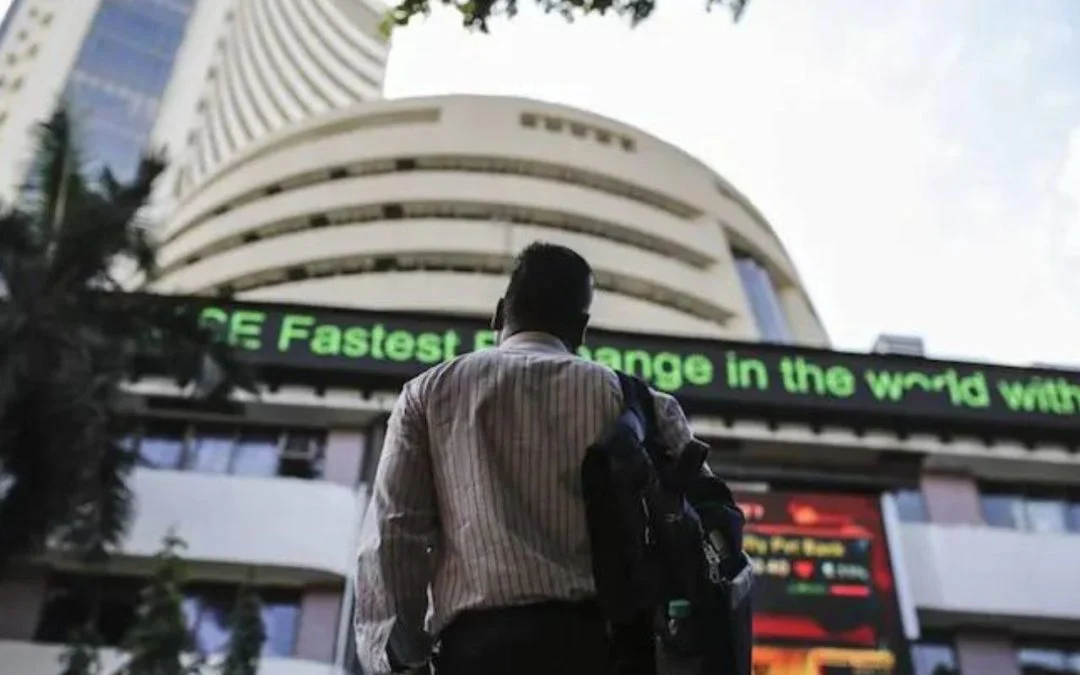
On Friday, Indian equity markets demonstrated strong bullish momentum despite opening on a weaker note. Both the Nifty 50 and BSE Sensex recovered steadily throughout the session, closing with solid gains and maintaining levels above their key technical moving averages. This positive movement was supported by the Reserve Bank of India’s recent decision to cut […] The post Nifty, Bank Nifty & BSE Sensex Action for 8th of December 2025: Key levels & Trade setups appeared first on Trade Brains.


On Friday, Indian equity markets demonstrated strong bullish momentum despite opening on a weaker note. Both the Nifty 50 and BSE Sensex recovered steadily throughout the session, closing with solid gains and maintaining levels above their key technical moving averages. This positive movement was supported by the Reserve Bank of India’s recent decision to cut the repo rate, which has boosted investor confidence and is expected to stimulate domestic demand by making borrowing more affordable.
Sector-wise, banking and financial stocks led the gains, reflecting optimism around the rate cut, while media and small-cap segments experienced some selling pressure. Meanwhile, the broader Asian markets showed mixed performances, with some indices posting gains and others retreating. Overall, the domestic market ended the week nearly flat, absorbing the impact of monetary easing measures aimed at supporting economic activity.
In this overview, we will analyse the key technical levels and trend directions for Nifty and BSE Sensex to monitor in the upcoming trading sessions. All the charts mentioned below are based on the 15-minute timeframe.
NIFTY 50 Chart & Price Action Analysis
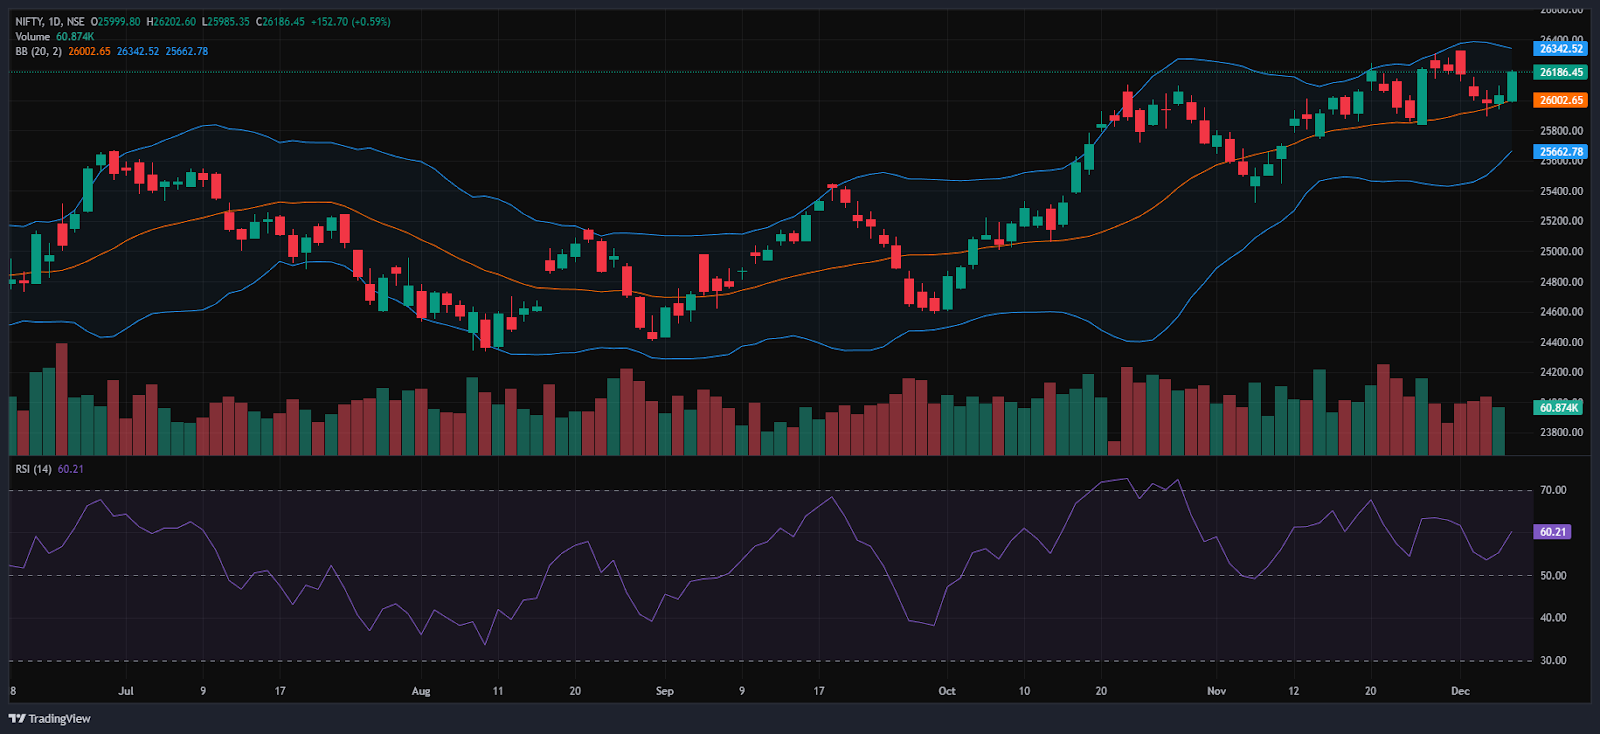
The Nifty 50 Index opened on a flat to negative note at 25,999.80 on Friday, down by 33.95 points from Thursday’s closing of 26,033.75. The index started the session on a bearish note, opened below the 26,000 level and was dragged down to hit its day’s low near the 25,985.35 mark. Later, the Index recovered from low and rallied to the 26,197.4 level in the morning session. It was trading within the range of 25,950 and 26,200. In the afternoon session, the index hit the day’s high near 26,202.60 and settled near the 26,150 mark. The Index was trading between the range of 26,100 and 26,200. Finally, it had closed on a positive note at 26,186.45, up by 152.7 points, or 0.59%. In the short term, the Index was above the 13- and 20-day EMA, indicating a short-term bullish outlook in the daily time frame.
The Nifty 50’s nearest resistance levels are at 26,225 (R1) and 26,314.45 (R2). On the other hand, the closest support is now at 25,970 (S1), and the next one at 25,890 (S2), which were previous resistances now acting as support.
Trade Setup:
| Nifty 50 | |
| Resistance 2 | 26,314.45 |
| Resistance 1 | 26,225.00 |
| Closing Price | 26,186.45 |
| Support 1 | 25,970.00 |
| Support 2 | 25,890.00 |
NIFTY 50 Momentum Indicators Analysis
RSI (Daily): The Nifty 50’s RSI stood at 60.21, which is below the overbought zone of 70, indicating room to grow higher.
Bollinger Bands (Daily): The index is trading in the upper band of the Bollinger Band range and above the middle band. Its position in the upper range suggests a bullish sentiment in the short term. However, on Friday’s session, the Index formed a Big bullish candlestick pattern, with a small wick on both sides, indicating bullishness. The index stayed above the 26,150 level on Friday’s session and was hovering near the 26,200 level. A sustained move above the middle band signals a bullish sentiment, while a drop back toward the lower band may reinforce bearish sentiment.
Volume Analysis: Friday’s trading session had an average volume of 249.25 Mn.
Derivatives Data: Options open interest (OI) data suggest a strong support zone around 26,000 and 26,150, where put option writing is high, indicating traders expect the index to hold these levels. On the upside, significant call option open interest at 26,200 and 26,300 signals resistance, as sellers are likely to defend these strike prices. The Put/Call Ratio (PCR) stands at 1.19, which is above 1 and indicates a neutral to bearish sentiment with more put activity than call. The presence of a short covering indicates that investors who had previously bet on a stock’s price to fall are now buying shares to close out their short positions, which is generally considered a bullish signal. This combination implies the market may trade in a range, with strong support near 26,000-26,150 and resistance near 26,200-26,300, until a decisive breakout occurs.
Bank Nifty Chart & Price Action Analysis
The Bank Nifty Index opened on a negative note at 59,133.20, below the 59,150 level, on Friday, down by 155.5 points from Thursday’s closing of 59,288.70. The index, though opening on a negative note, soon moved upwards after the RBI repo rate cut. During the morning session, the index was trading in an uptrend, in the range of 59,150 and 59,600 levels. In the afternoon session, the index continued the positive momentum, and it was trading in the range of 59,550 and 59,750, ending the day above the 59,750 mark. The index had peaked at 59,806.60, and had its day’s low at 59,106.55. Finally, it had closed on a bullish note at 59,777.20, up by 488.50 points or 0.82%. The Relative Strength Index (RSI) stood at 67.21, below the overbought zone of 70 in the daily time frame. In the short term, the Index was above the 13/20 day EMA on the daily time frame and formed a strong bullish candle on Friday, with smaller wicks, indicating a positive outlook in the near term.
The nearest resistance is at 59,860 (R1), and the higher resistance is at 60,114.30 (R2), which is the all-time high for the index. On the other hand, the closest support is now at 59,080 (S1), and the next support is at 58,750 (S2), where the index has taken support at this level previously.
Trade Setup:
| Bank Nifty | |
| Resistance 2 | 60,114.30 |
| Resistance 1 | 59,860.00 |
| Closing Price | 59,777.20 |
| Support 1 | 59,080.00 |
| Support 2 | 58,750.00 |
BSE Sensex Chart & Price Action Analysis
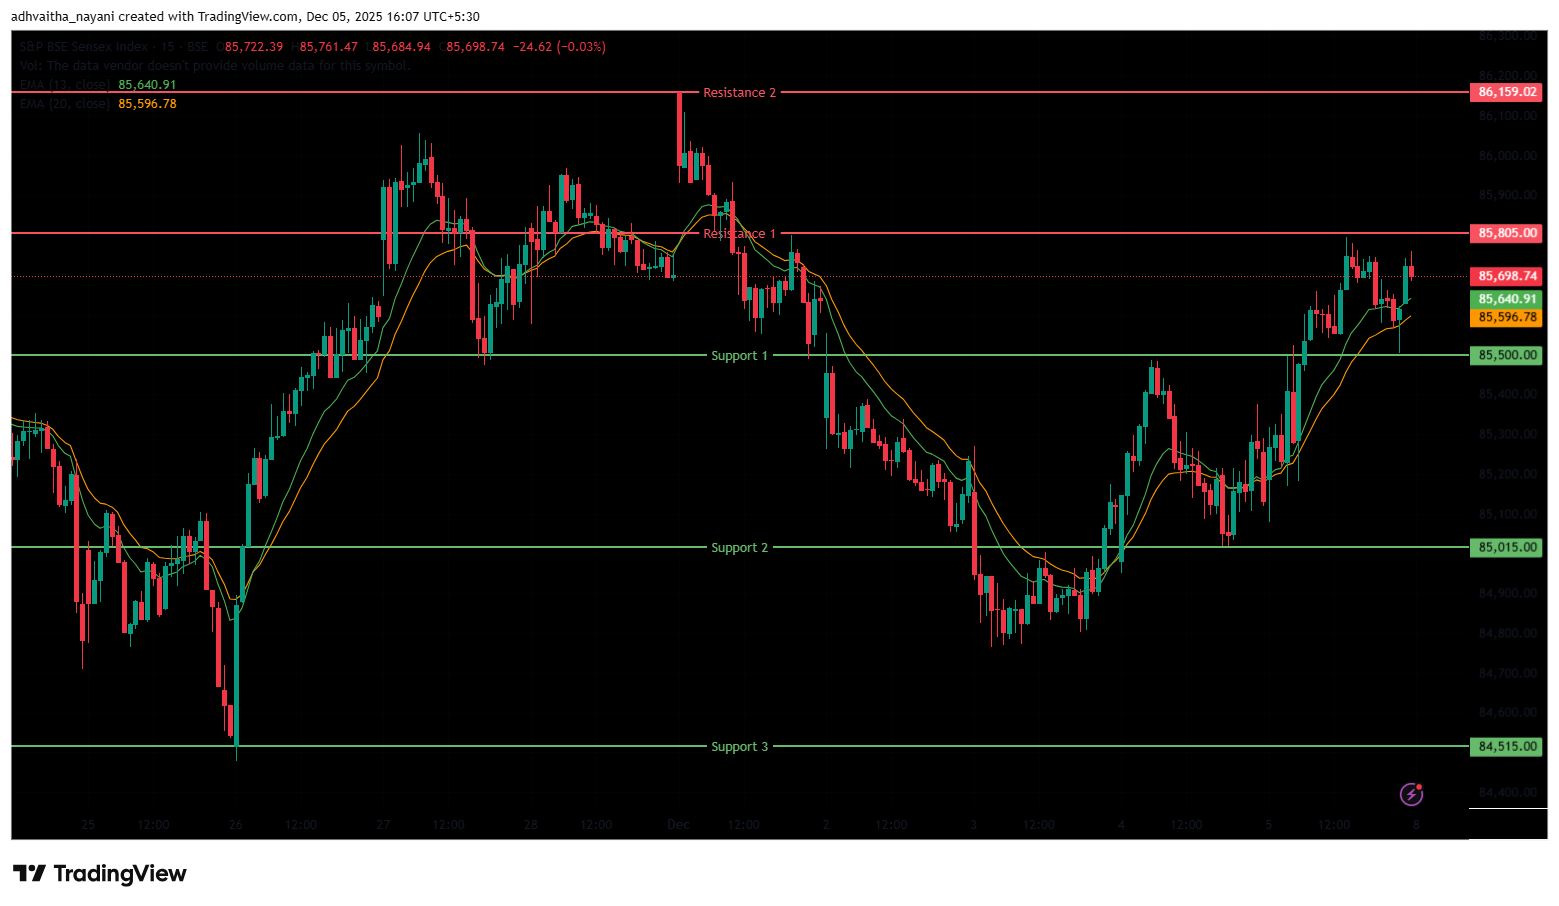
The BSE Sensex Index also opened on a negative note, opening at 85,125.48 on Friday, down by 139.84 points from Thursday’s closing of 85,265.32. The Sensex index started the session on a bearish note below the 85,150 mark; however, it continued to move upwards, similar to Nifty 50 and Bank Nifty. During the morning session, the index was trading on an overall optimistic note, in the range of 85,200 and 85,600. However, in the afternoon session, the index was slightly volatile, trading between 85,500 and 85,700. Sensex peaked at 85,796.82, and had a day’s low at 85,078.12. Finally, it had closed at 85,712.37 on a positive note, up 447.05 points or 0.52%. The Relative Strength Index (RSI) stood at 61.99, below the overbought zone of 70 in the daily time frame. In the short term, the Index was above the 13/20 day EMA on the daily time frame and formed a strong bullish candle on Friday, with smaller wicks, indicating a positive outlook in the near term.
The index faces immediate resistance at 85,805 (R1), and the higher resistance is at 86,159.02 (R2), a level near its all-time high. On the downside, the nearest support lies at 85,500 (S1) and the next one at 85,015 (S2), which was previously resistance and now acts as support; the next one is at 84,515 (S3).
Trade Setup:
| Sensex | |
| Resistance 2 | 86,159.02 |
| Resistance 1 | 85,805.00 |
| Closing Price | 85,712.37 |
| Support 1 | 85,500.00 |
| Support 2 | 85,015.00 |
| Support 3 | 84,515.00 |
Market Recap on December 5th, 2025
On Friday, the Nifty 50 opened lower at 25,999.80, down by -33.95 points from its previous close of 26,033.75. The index hit an intraday low of 25,985.35 and closed on a bullish note, above the 26,150 level at 26,186.45, up 152.70 points, or 0.59%. The index closed above all key moving averages (20/50/100/200-day EMAs) on the daily chart. The BSE Sensex followed the same trajectory, opening on a negative trend at 85,125.48, down -139.84 points from the previous close of 85,265.32. It closed at 85,712.37, up 447.05 points, or 0.52%. Both indices showed bullish momentum, with RSI values for the Nifty 50 at 60.21 and the Sensex at 61.99, below the overbought threshold of 70. The major indices continued to gain for the second consecutive day, with Friday’s gain mainly attributed to the RBI’s Repo Rate cut by 25 BPS to 5.25%.
On Friday, major gainers were the Nifty PSU Bank index, which rose 1.51% or 125.05 points and stood at 8,381.75. Stocks such as State Bank of India rose 2.47%, followed by Punjab National Bank and Bank of Baroda, which increased by up to 1.8% on Friday. The Nifty Finance index was also among the biggest gainers, increasing 0.98%, or 270.45 points, and standing at 27,881. Stocks such as SBI Cards & Payment, Cholamandalam Investments, and Shriram Finance Ltd all rose by up to 3.4% on Friday.
On the other hand, the Nifty Media index was the major loser, falling -0.48% or -6.85 points, and standing at 1,434.55. Stocks such as Tips Music Ltd fell by -3.4%, followed by Hathway Cable and Sun TV Network Ltd, which decreased by up to -1% on Friday. The Nifty SmallCap 50 index was also among the biggest losers, falling -0.37% or -31.85 points, and standing at 8,579.7. Stocks such as Kaynes Technology India were down -12.55% on Friday. While other stocks, like PG Electroplast Ltd and Bandhan Bank Ltd, also decreased by up to -4.3%. The Nifty MNC index was also among the top losers, falling -0.21% or -64.45 points, and standing at 30,196.
Asian equity markets closed mixed. Japan’s Nikkei 225 declined -536.55 points, or 1.05%, to close at 50,491.87. In contrast, China’s Shanghai Composite rose 27.01 points, or 0.70%, to 3,902.81, while Hong Kong’s Hang Seng Index rose 149.18 points, or 0.58%, to 26,085.08. South Korea’s KOSPI surged 71.54 points, or 1.78%, closing at 4,100.05.
The Nifty 50 closed the week down by 16.5 points, a marginal decline of 0.06%, while the BSE Sensex also finished nearly flat with a small loss of 5.7 points, or 0.01%, over the week. This week, the RBI reduced the repo rate from 5.50% to 5.25%, a move expected to boost domestic demand and lower borrowing costs for retail consumers.
India VIX
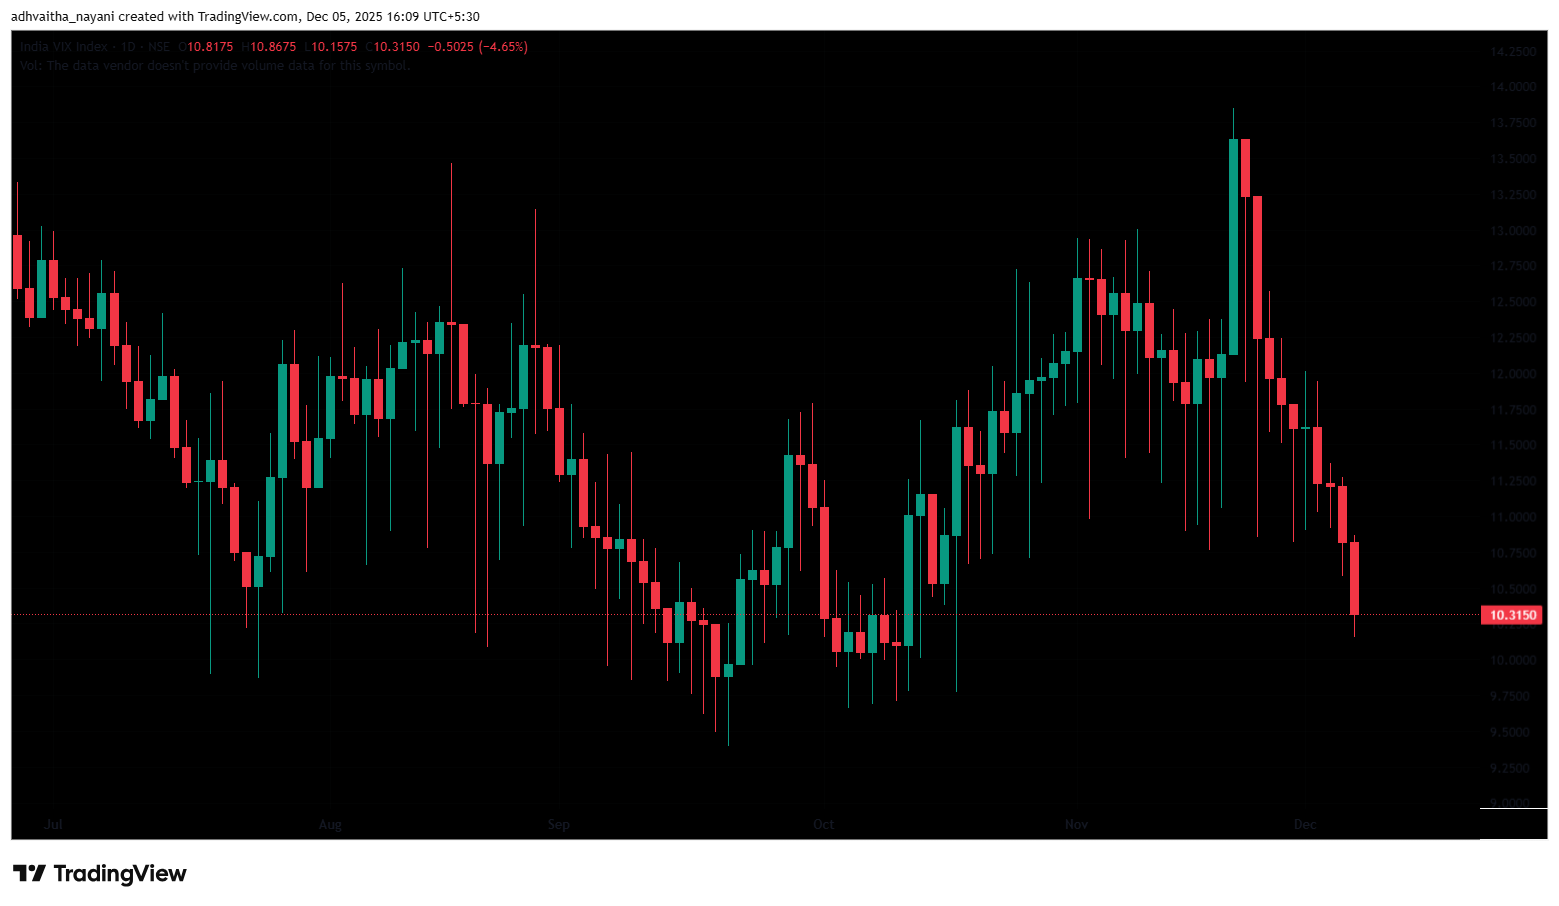
The India VIX fell to 10.32, down by 0.50 points (4.62%) during Friday’s trading session, indicating stable sentiment in expected market volatility in the daily time frame. However, overall volatility remains low, since the India VIX is generally considered elevated only when it rises above 15.
Given the ongoing volatility and mixed sentiments, it’s advisable to avoid aggressive positions and wait for clear directional moves above resistance or below support. Traders should consider these key support and resistance levels when entering long or short positions following the price break from these critical levels. Additionally, traders can combine moving averages to identify more accurate entry and exit points.
The post Nifty, Bank Nifty & BSE Sensex Action for 8th of December 2025: Key levels & Trade setups appeared first on Trade Brains.
What's Your Reaction?